We are happy to announce the first major extension to our newly launched Dashboard – the addition of IoT device statistics and server-side attack statistics, data sets that have been collected as part of the HaDEA EU CEF VARIoT project.
IoT Device Statistics
Shadowserver has been fingerprinting IoT devices worldwide through its full IPv4 space and IPv6 hitlist-based daily scans. Data from all our daily scans is classified by an internal scan rule engine by device vendor, model and type. The classification is based on multiple scan data features, such as various protocol banners returned, SSL/TLS certificate fields, HTTP body content, HTTP cookies, SNMP strings etc.
You can now get a unique view of IoT devices and other devices that are exposed on the Internet. Of course, this does not encompass all IoT devices, just those that are reachable by our scans and those we were able to fingerprint. Currently we identify the device manufacturer and model for nearly 200 different vendors. More fingerprints are constantly being added, so that number is sure to grow!
Please note this is population level data and no vulnerability assessment is being made, though likely many of these devices should not be externally accessible!
Example queries:
https://dashboard.shadowserver.org/statistics/iot-devices/map/
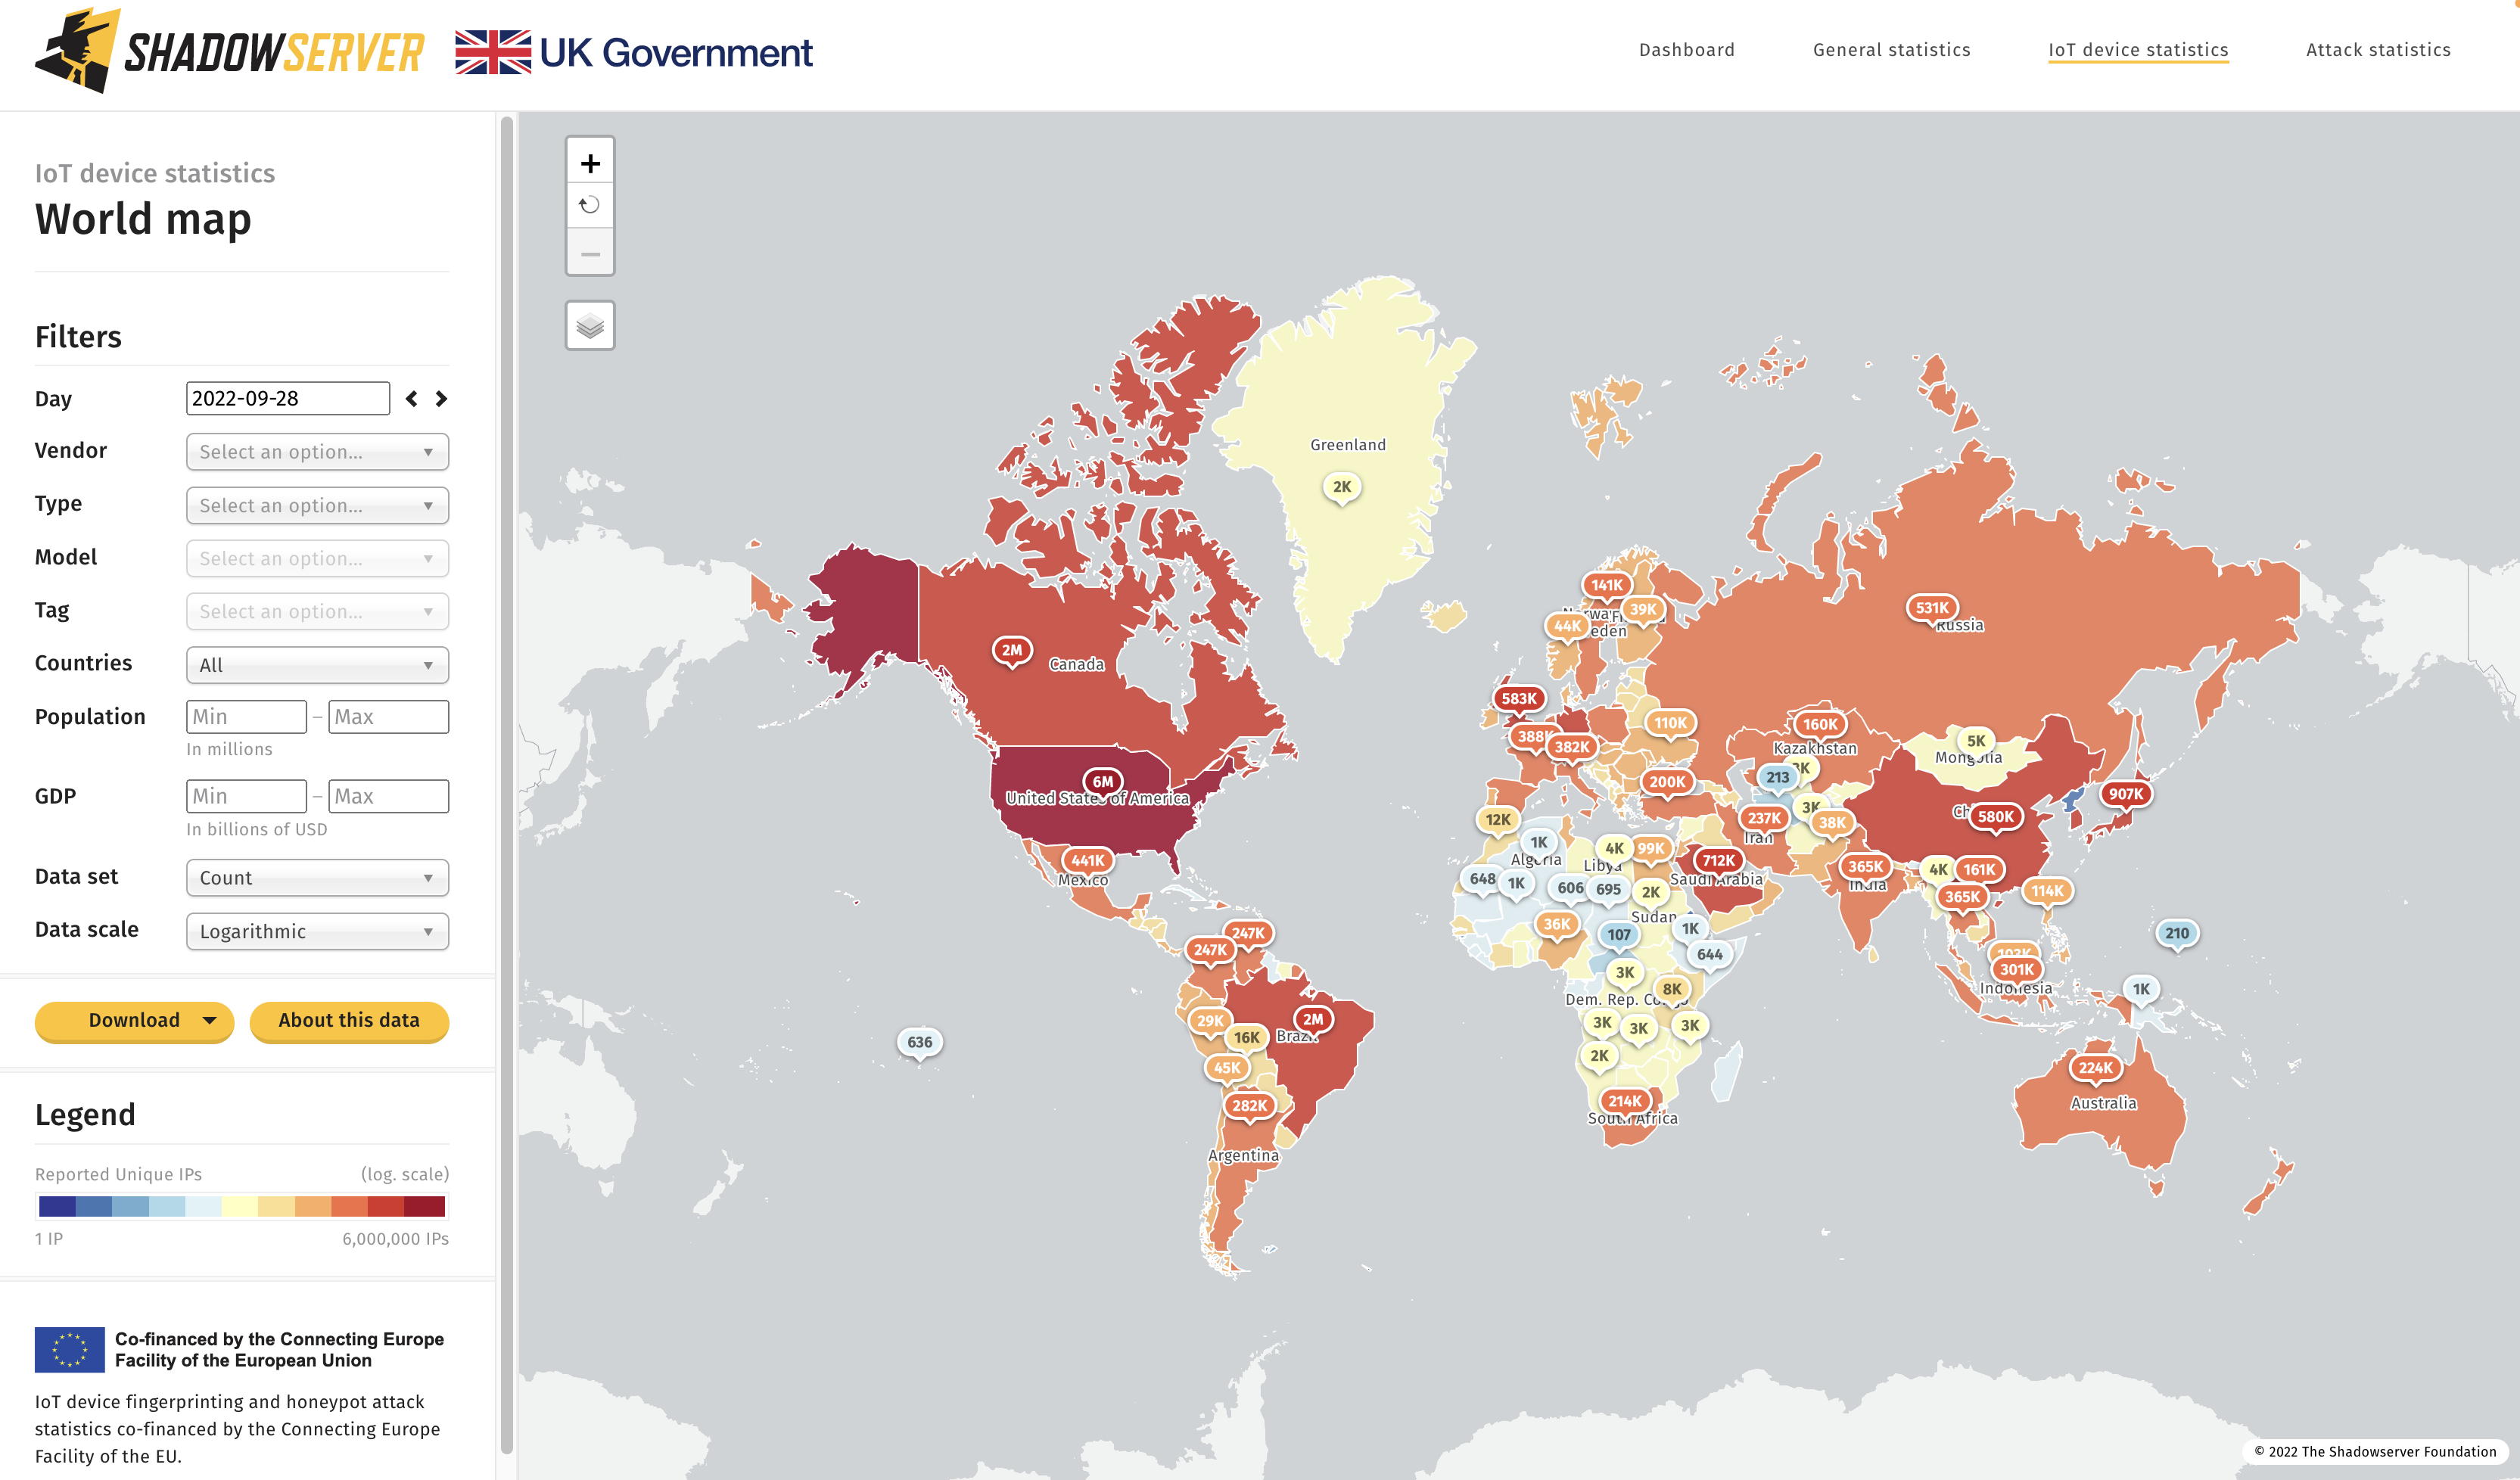
Top exposed devices by country – 2022-09-28
https://dashboard.shadowserver.org/statistics/honeypot/tree/
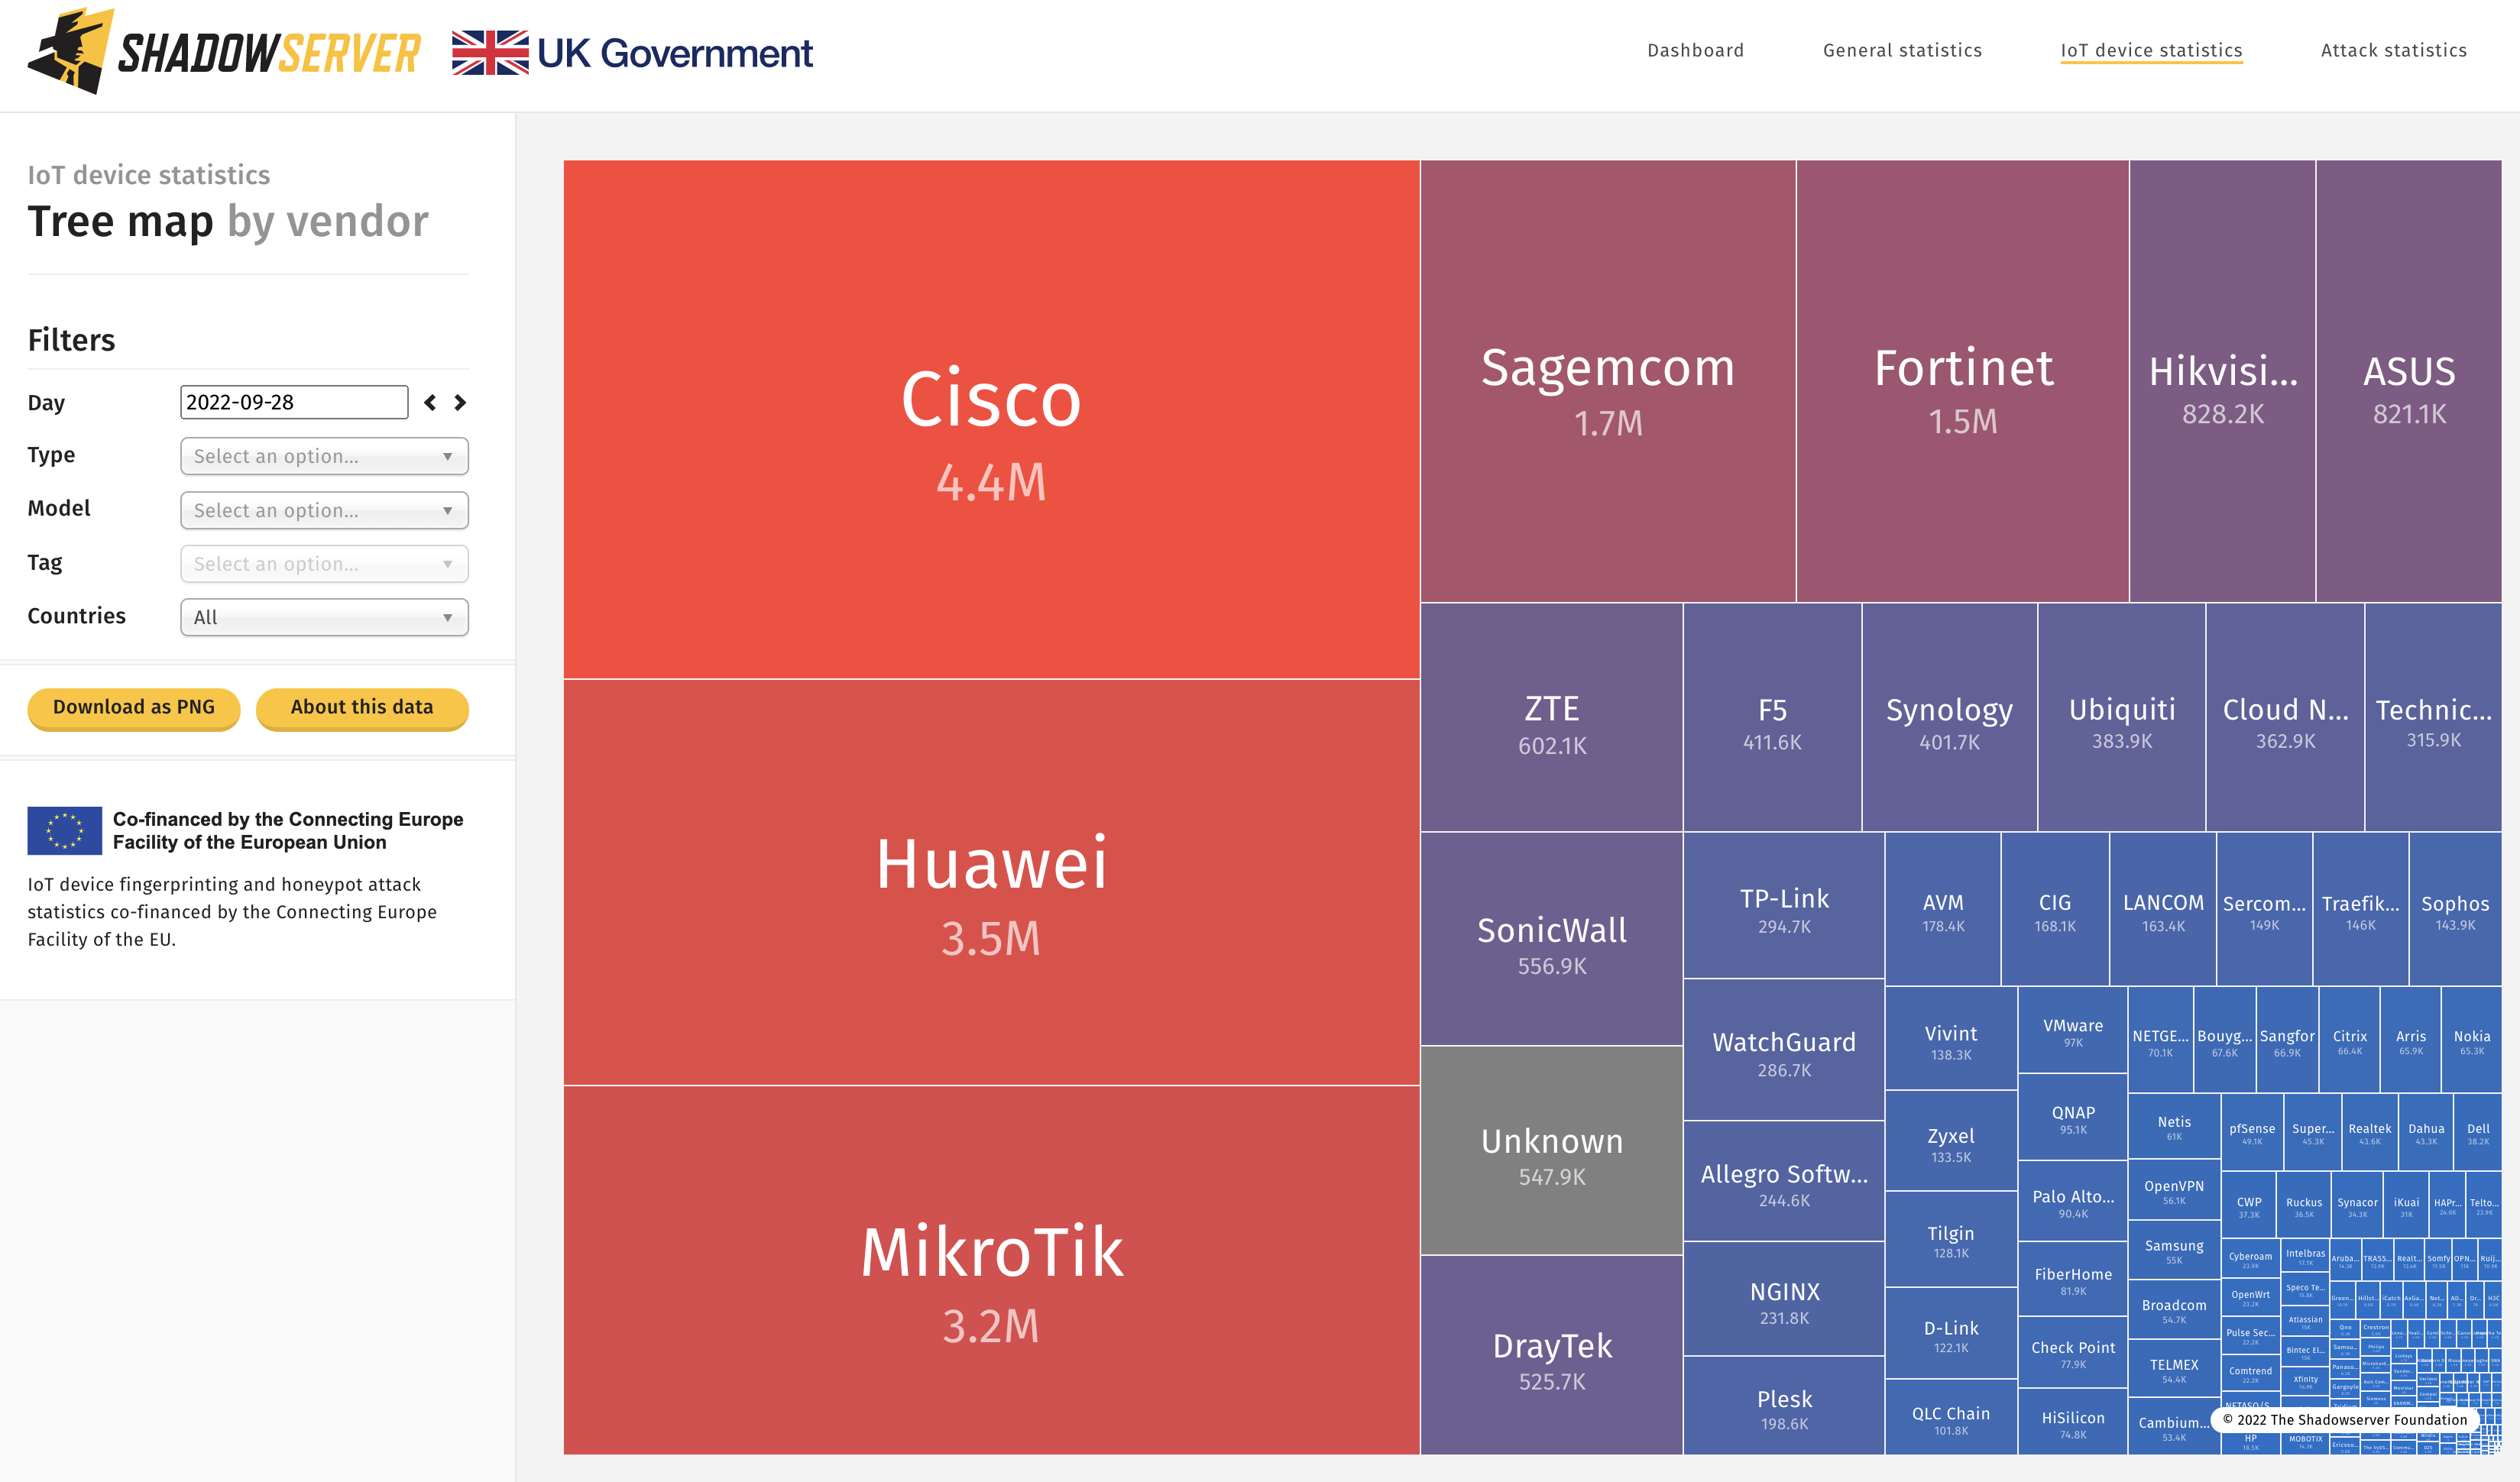
Top identified exposed devices by vendor – World (2022-09-28)
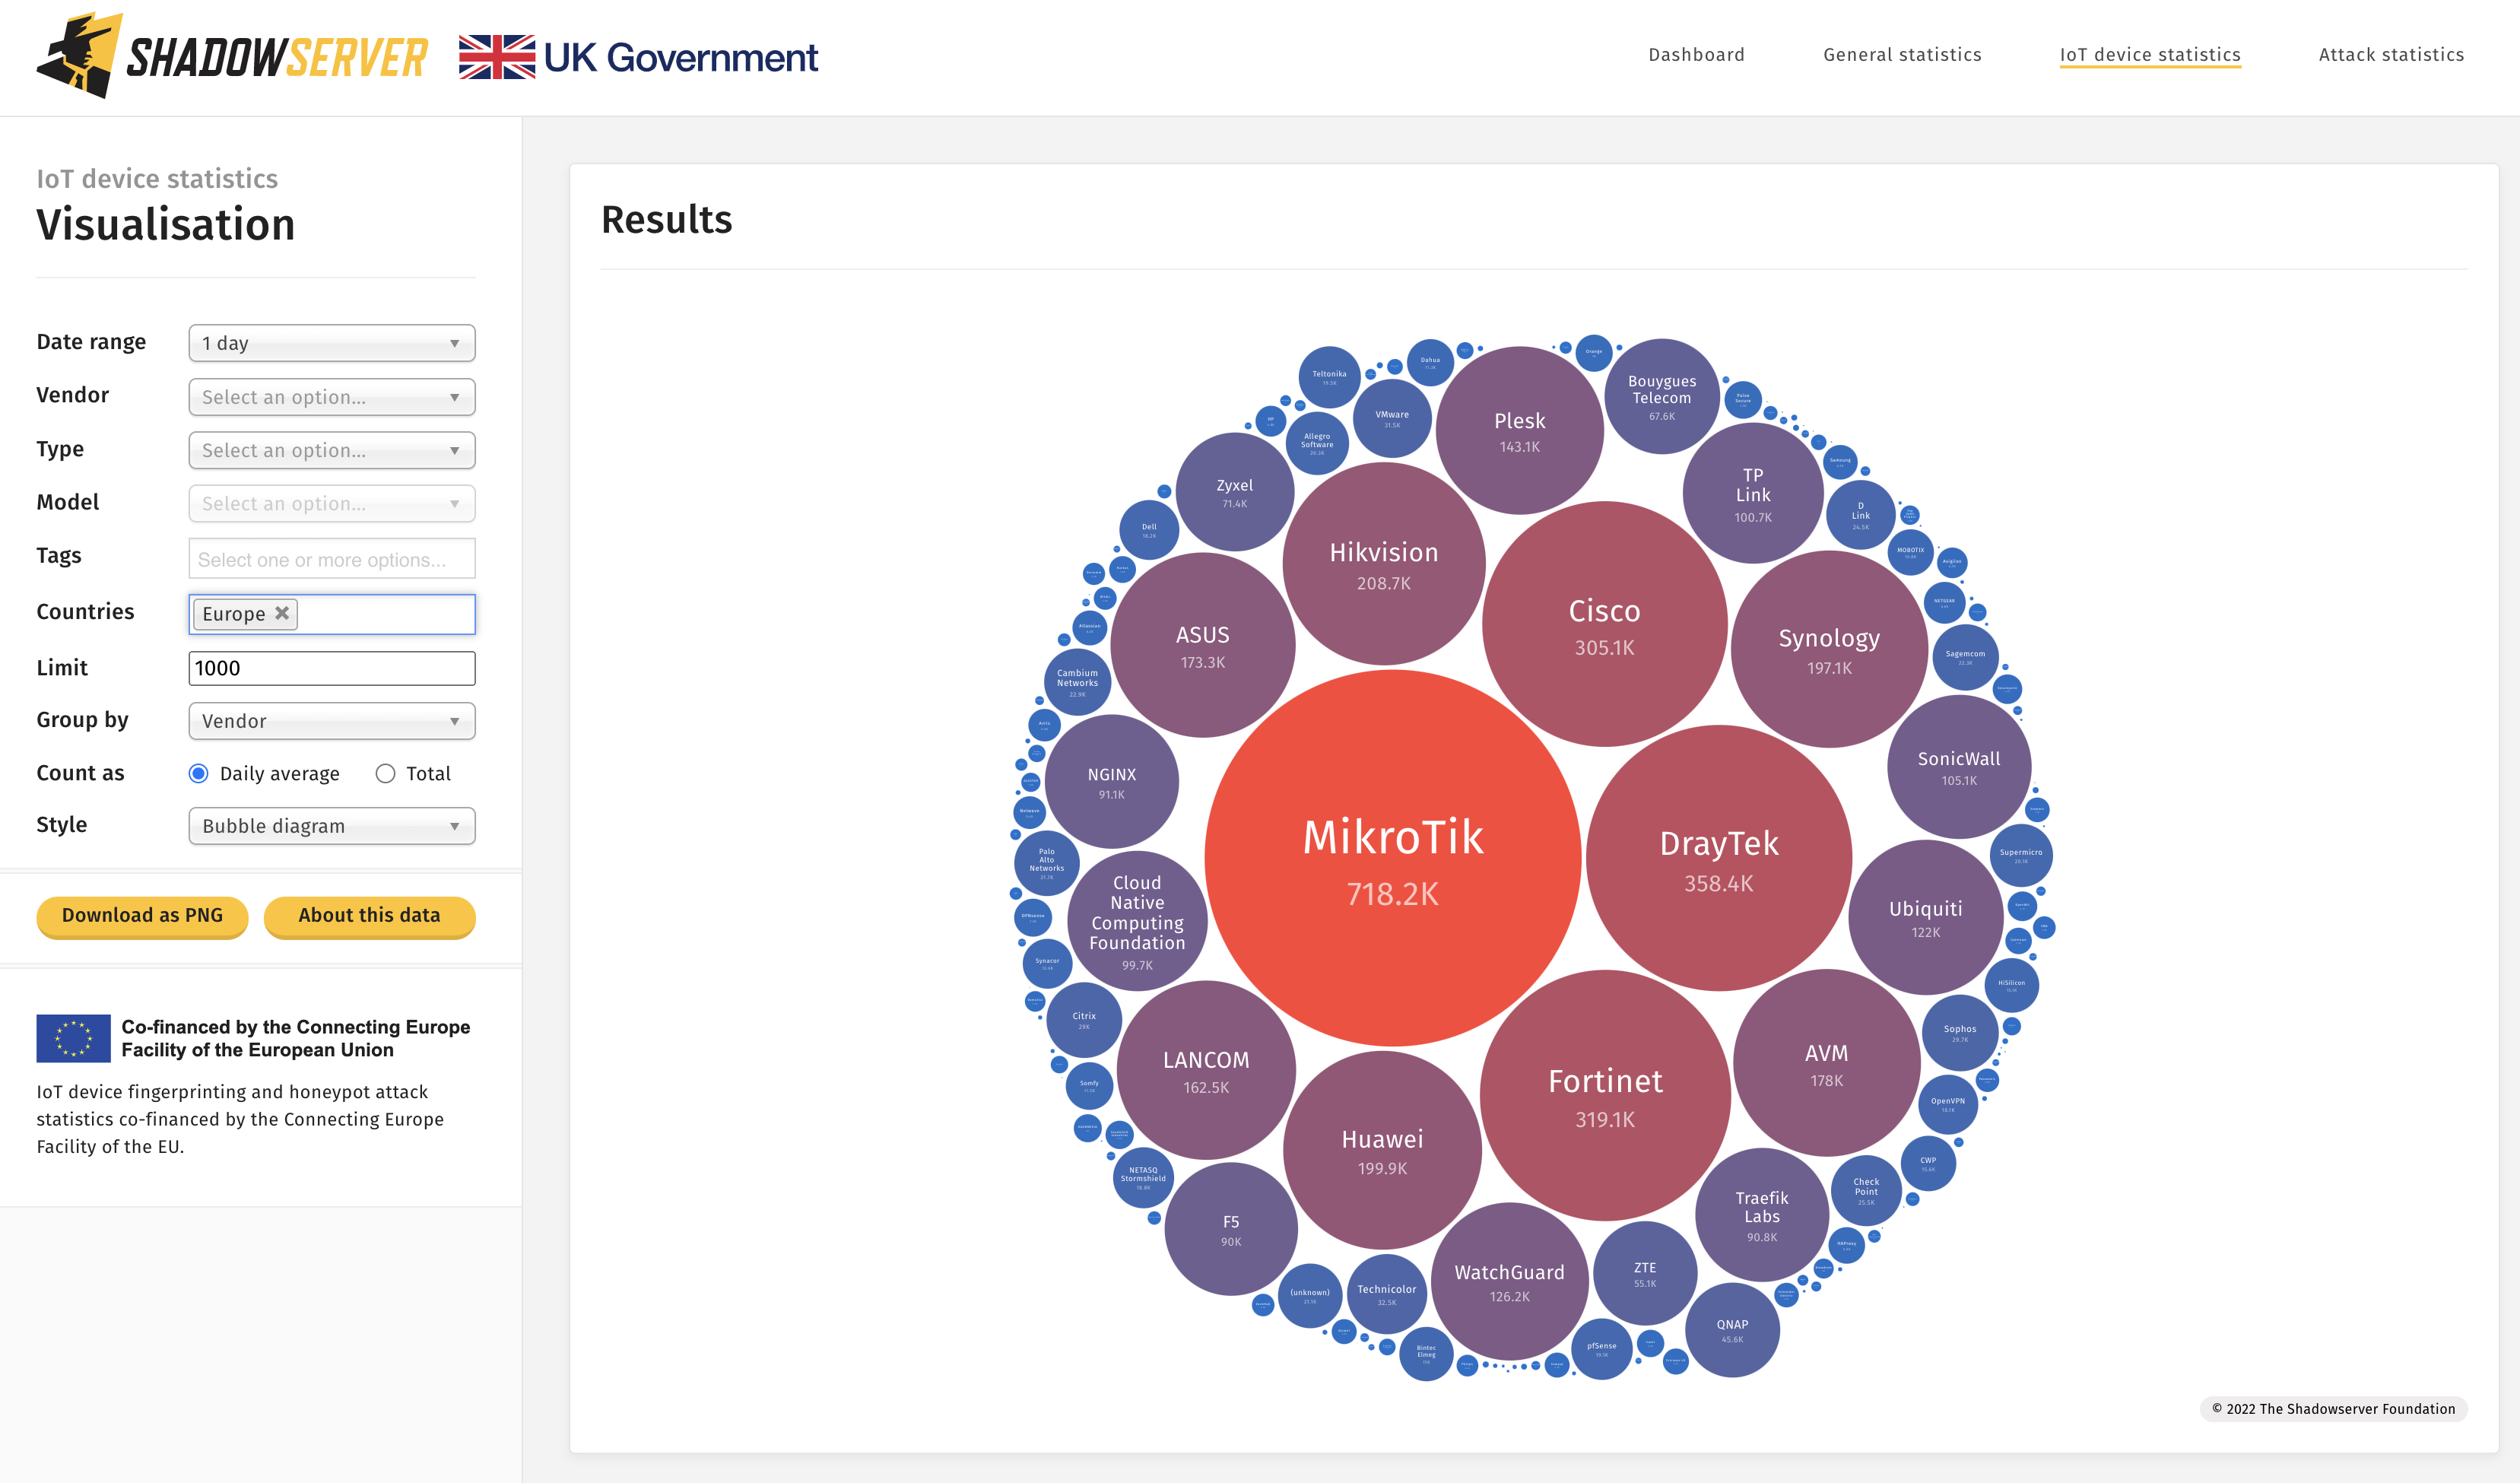
Top identified exposed devices by vendor in Europe (2022-09-28)
Curious how many Roomba vacuum cleaners are exposed on the Internet? Click here to find out!
Attack Statistics
Shadowserver maintains a large-scale honeypot network originally developed as part of the EU Horizon 2020 SISSDEN project. Under VARIoT and FCDO UK funding this network has continued to evolve. It consists of a variety of honeypots, including web-based ones. These web–based honeypots are used to identify and classify various server-side attacks by the vulnerability that is being exploited. This is done by assigning CVE, EDB, CNVD or other tags. As a result we can get an overview of different server-side attacks that can be observed. New tags are constantly being added.
Aside from map, treemap, time series and other standard views, we have also created a Top category of currently known exploited vulnerabilities as well as an anomaly detector to show current exploit trends.
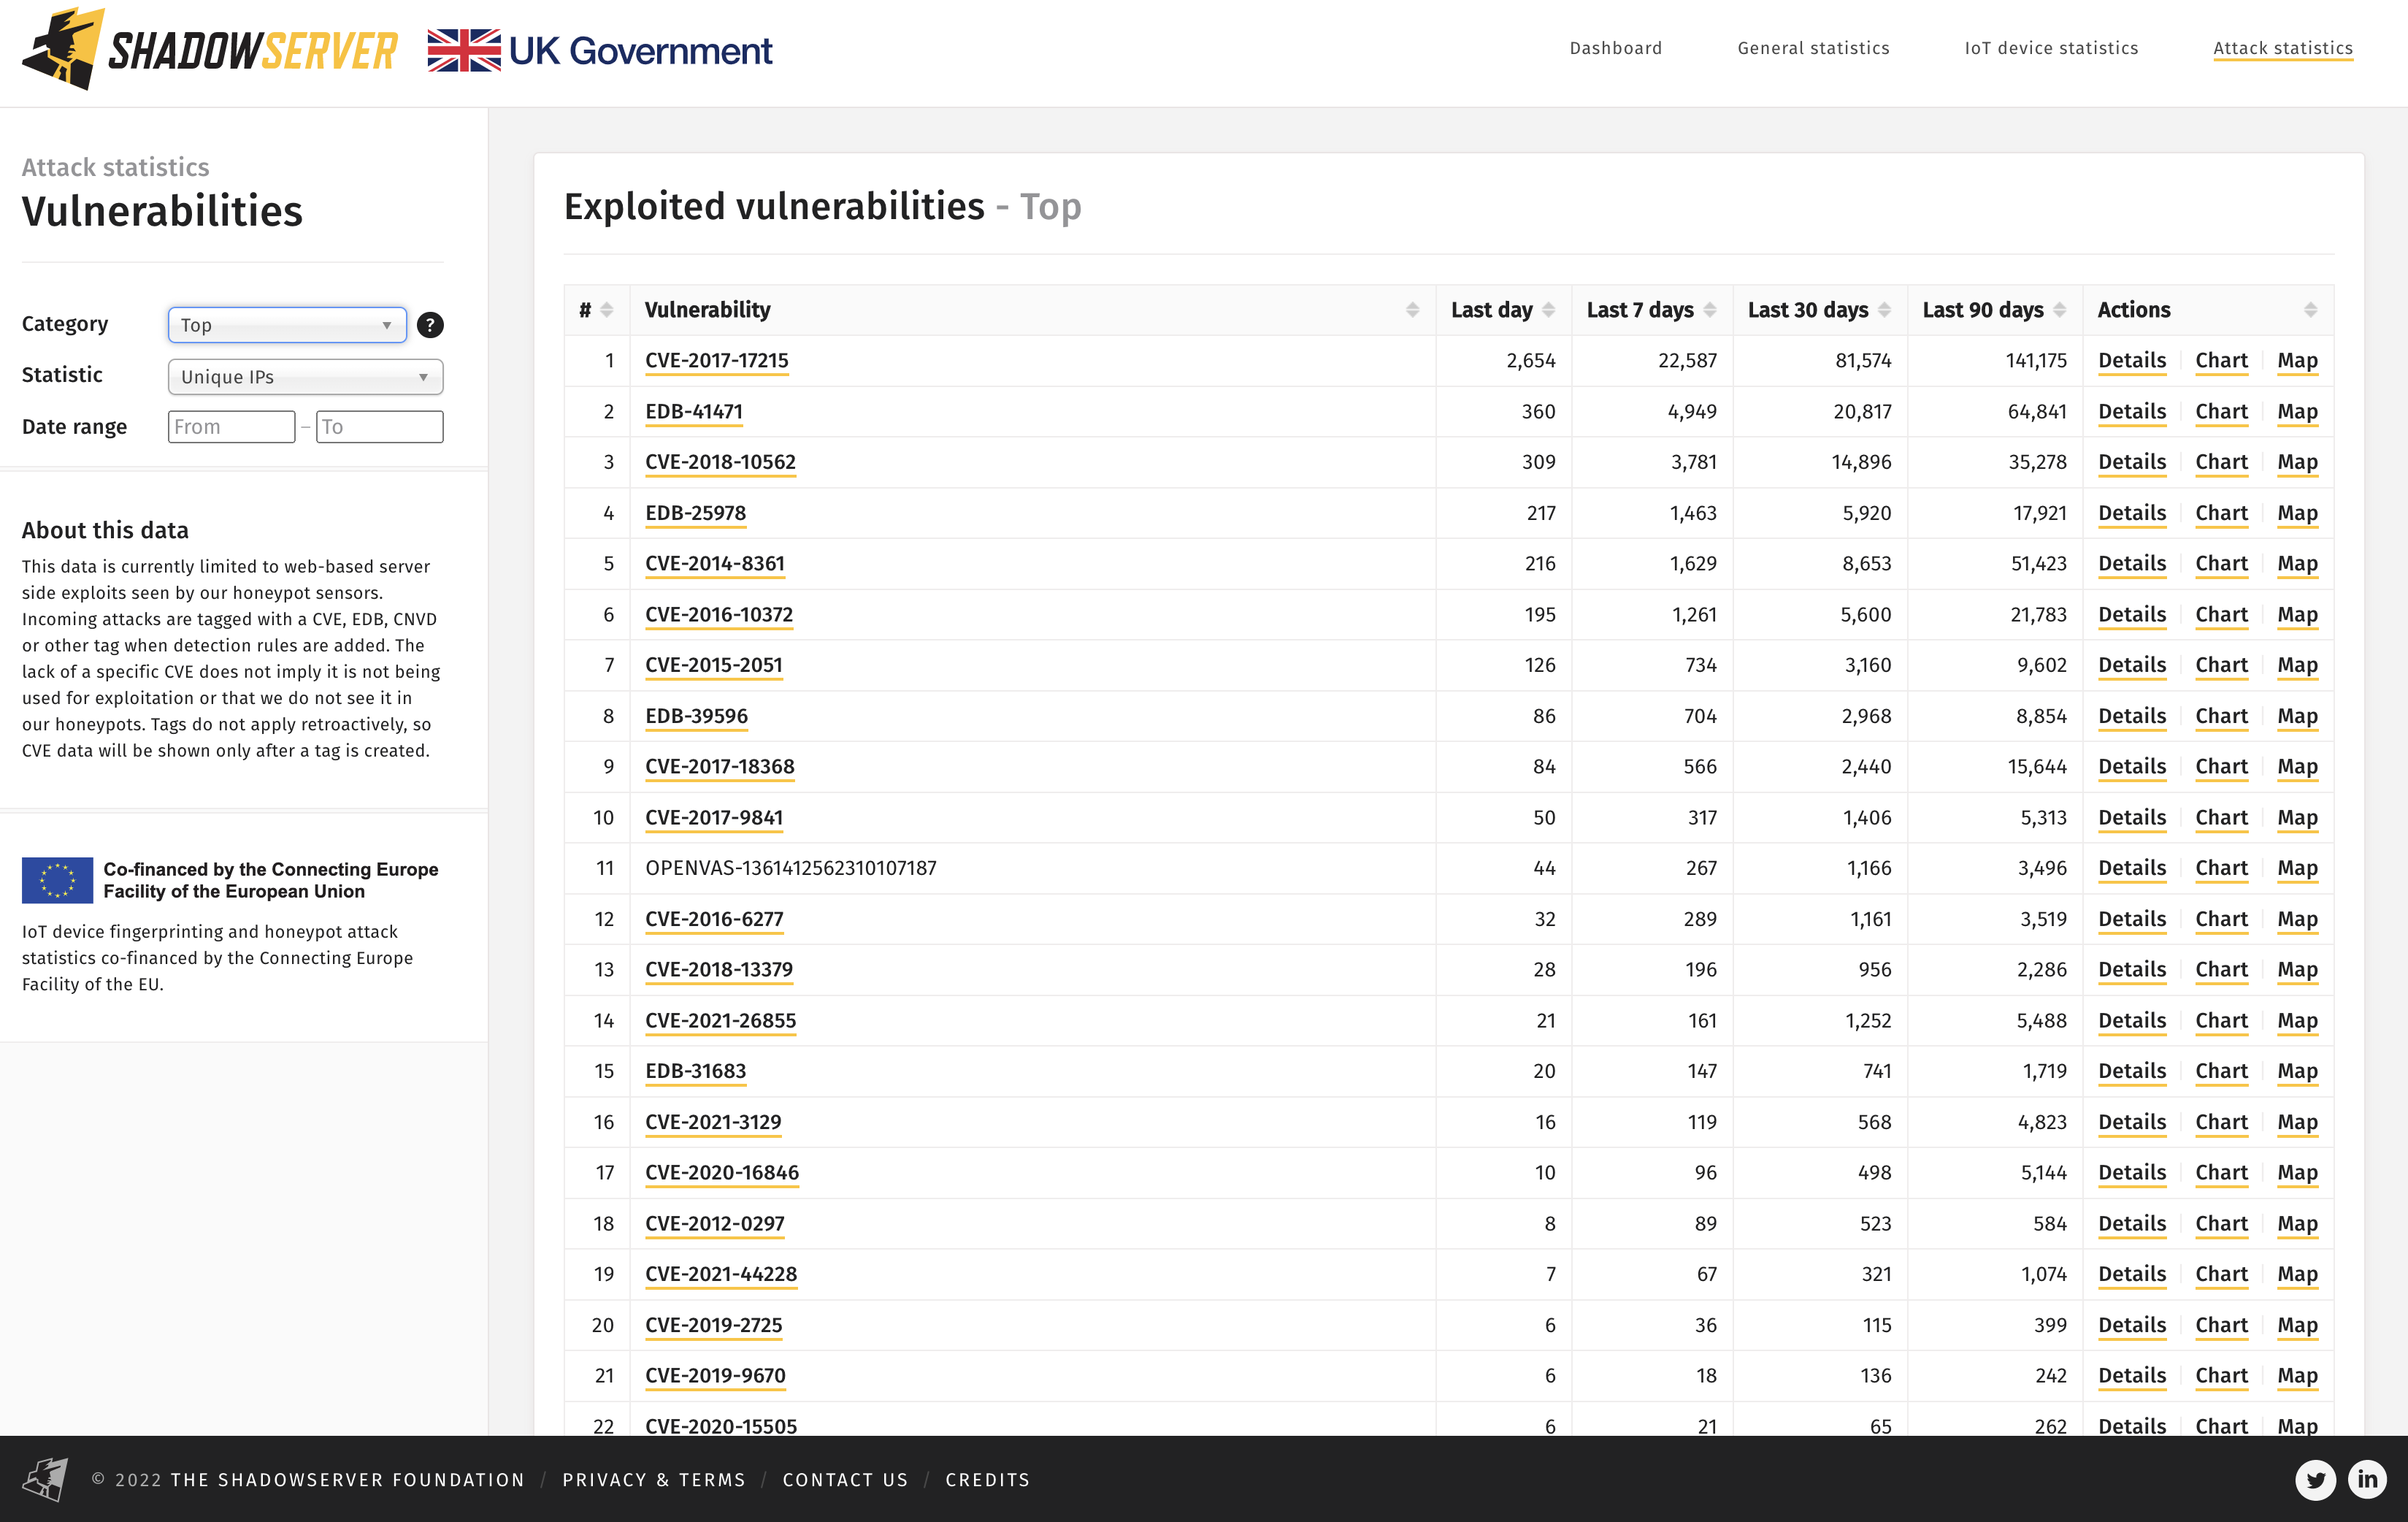
Top Exploited Vulnerabilities seen in our web honeypot sensors – 2022-09-28
We have also added a view of the trends related to the most common devices used for attacks and the top devices seen attacking. Information about the attacking devices is obtained through our IoT device fingerprinting scans. When an IP address is then seen attacking our honeypot sensors or darknet (aka. “network telescope”) systems we check it against the latest scan results for that IP address and infer the device manufacturer and model. Please note that this assessment is not necessarily 100% accurate due to device churn and port forwarding (multiple device types responding on different ports). The attack may also originate from a device behind the device IP address identified through scanning, that is actually infected or used for attacks (using network address translation (NAT)).
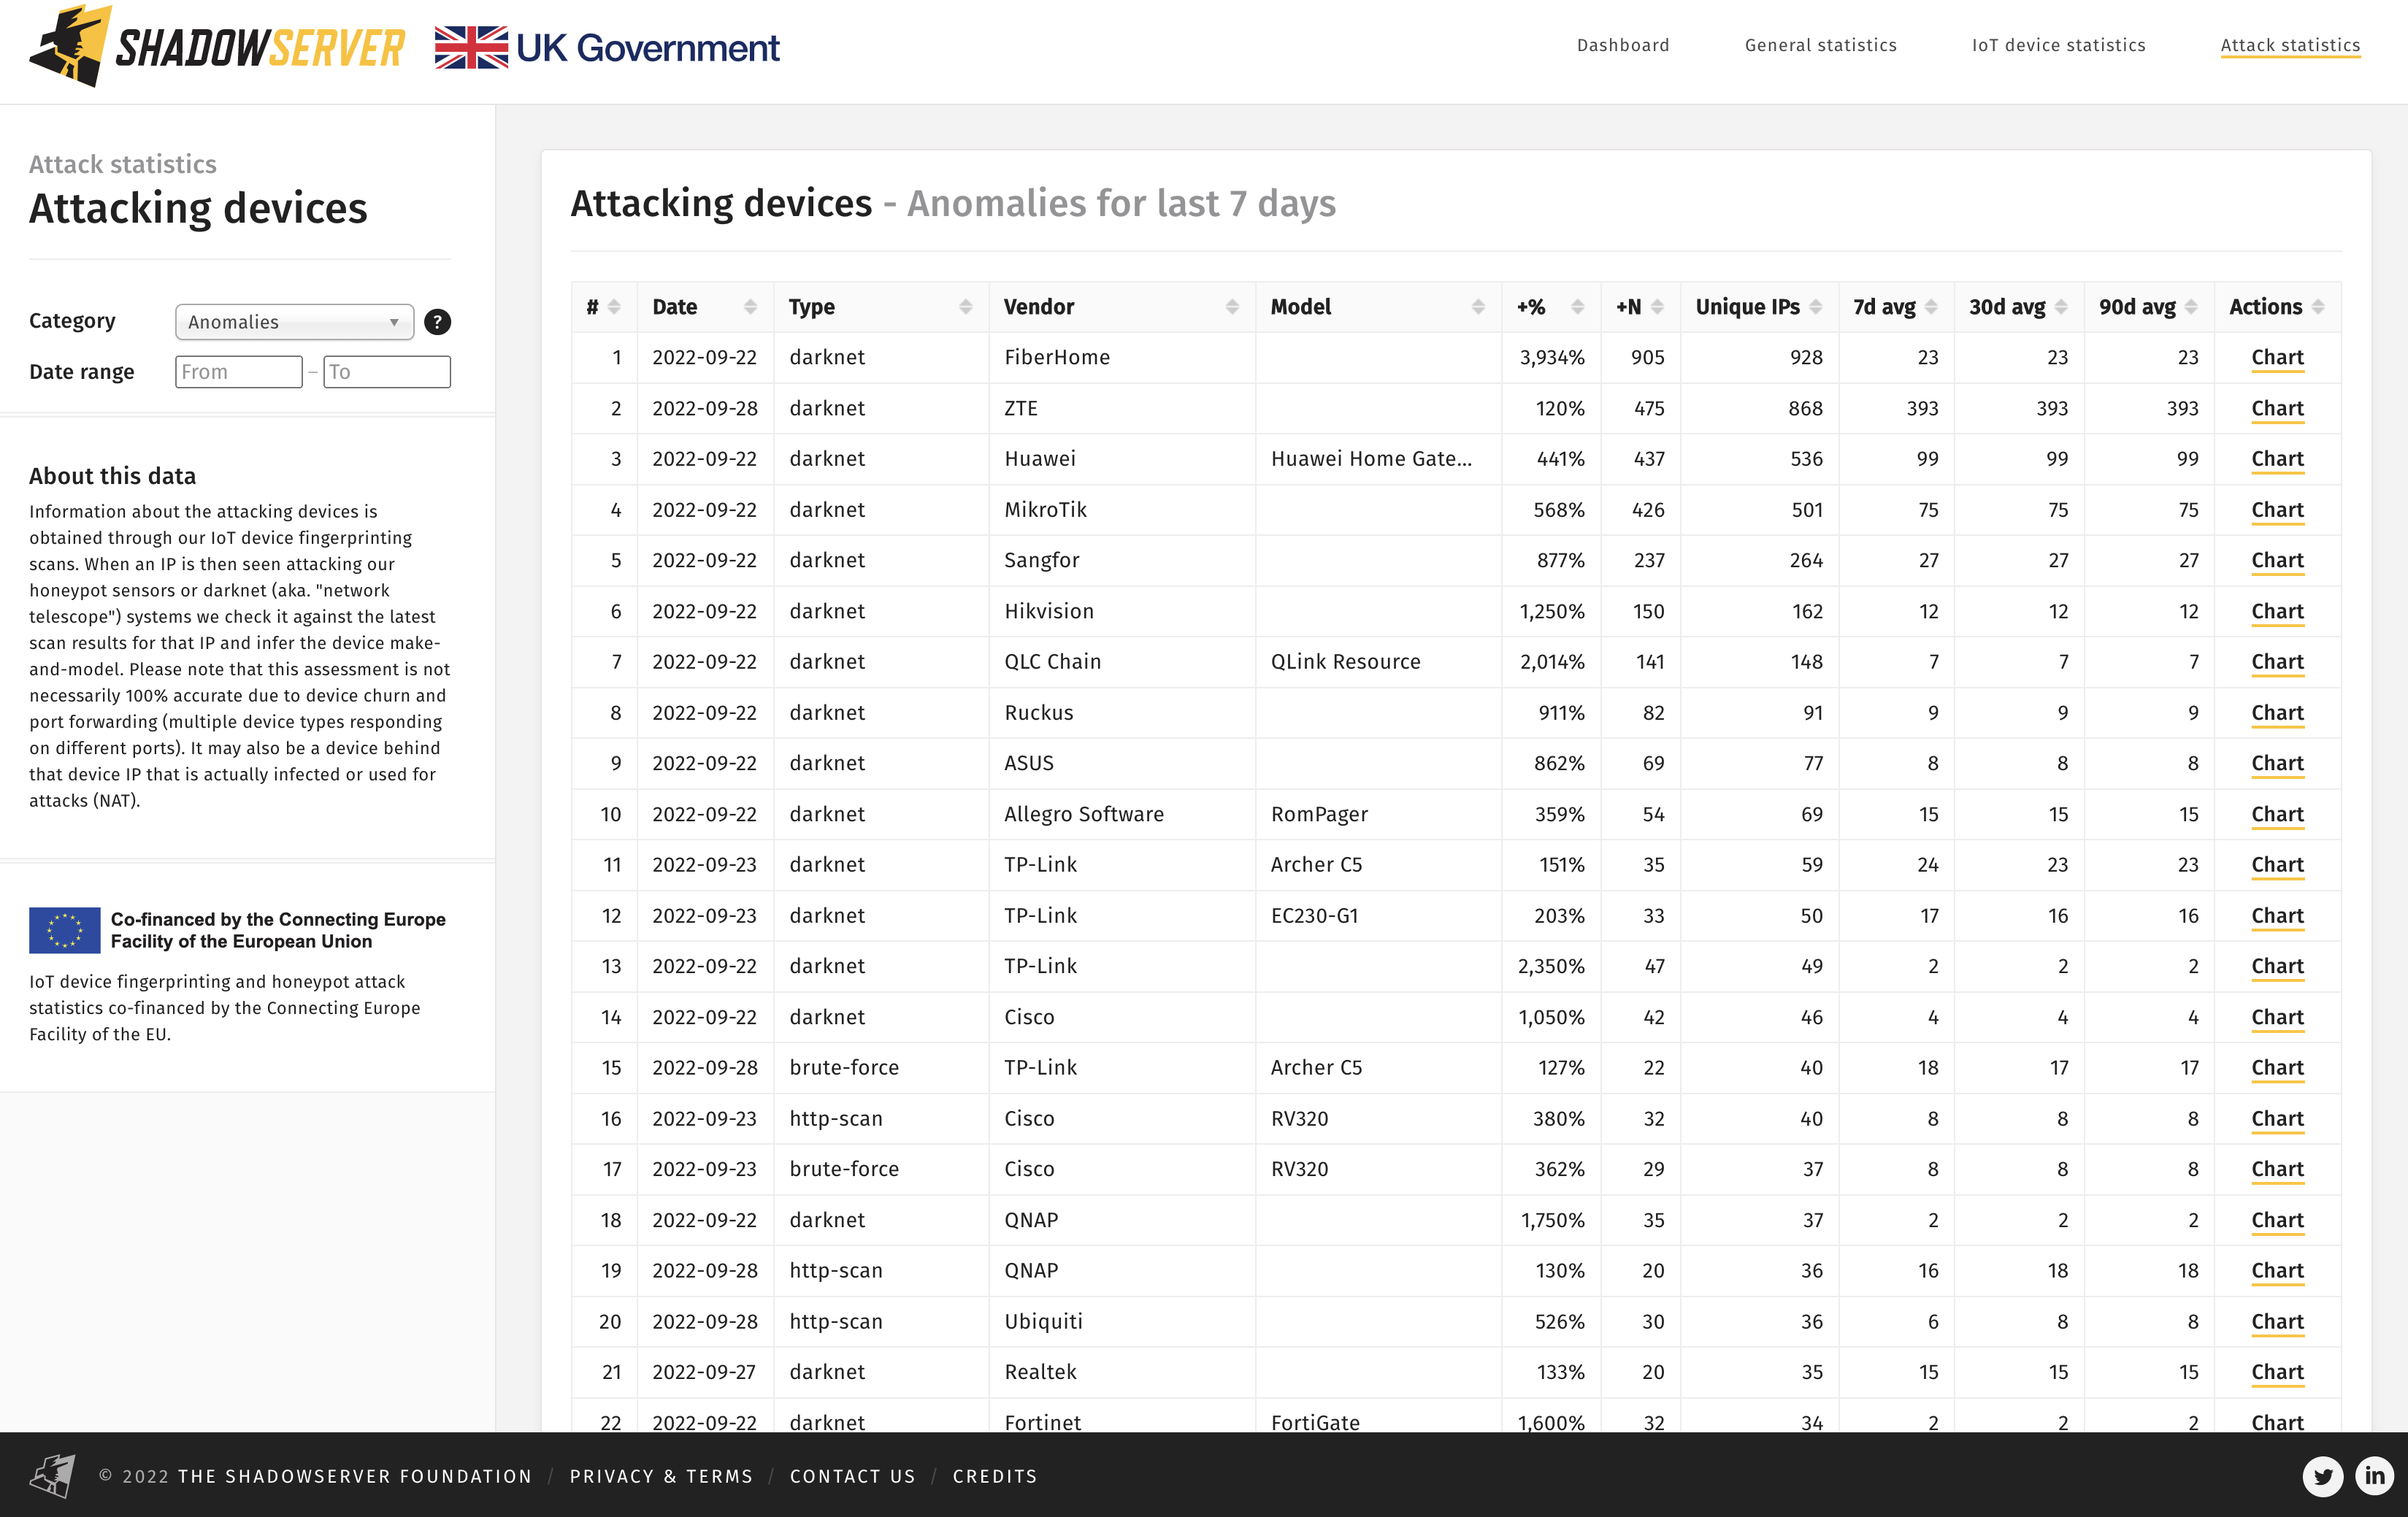
Anomalies in observed attacking devices by vendor – 2022-09-28
In all cases, attacking device anomalies are calculated by comparing a weekly moving average with the last day.
Find out here what the top infected device is!
Daily Data sharing
Statistics for identified IoT devices and infected devices are shared as CSV files in the European Data Portal daily. You can also visit all other VARIoT datasets in EDP here.
IP data with results from these scans is shared daily in the Device Identification Report. This is a device population report – no assessment is made on the vulnerability state of the device, though many of the devices on the list should not be externally accessible and may be an unnecessarily exposed attack surface.
IP data with detected web-based honeypot attack data is shared daily in the Honeypot HTTP Scanner Events Report.
As always, the IP data is filtered by a subscribers network, domain or constituency/country.
We are always interested in collaboration and will be adding more data sets to the Dashboard over time, as it becomes our go-to landing place for exploring data about new and emerging threats. We hope to eventually provide our constituents with authenticated access to more granular views of our data about their own individual networks/country through expanded, private dashboards. Join our new Shadowserver Alliance to help influence future research direction and gain additional behind the scenes insight on threats to global cyber security.
If you operate a network or CSIRT and don’t already subscribe to Shadowserver’s free daily network reports, please sign up here.