Keen watchers of Shadowserver will know that we have our own unique view of the Internet – informed by our daily worldwide scanning for exposed and abusable services, our large honeypot sensor networks that are used for detecting attacks, our extensive botnet sinkholing efforts, and many other data streams that we collate as part of our public benefit mission.
We have a long history of providing high quality, actionable cyber threat intelligence to network owners and National CSIRTs globally for free, every day. These technical data feeds are aimed at helping Internet defenders identify and remediate risks within their network/country that criminals seek to exploit, helping to raise the bar on cyber security globally.
We have always had the ambition of providing a graphical way to explore some of our extensive data sets. Unfortunately, new and improved data collection projects or support for the latest cybercrime disruption efforts have meant that we never actually made such a system available.
However, thanks to the generous support of the UK Foreign, Commonwealth & Development Office (FCDO), we are super excited to finally announce the launch of our new Shadowserver Public Dashboard:
https://dashboard.shadowserver.org
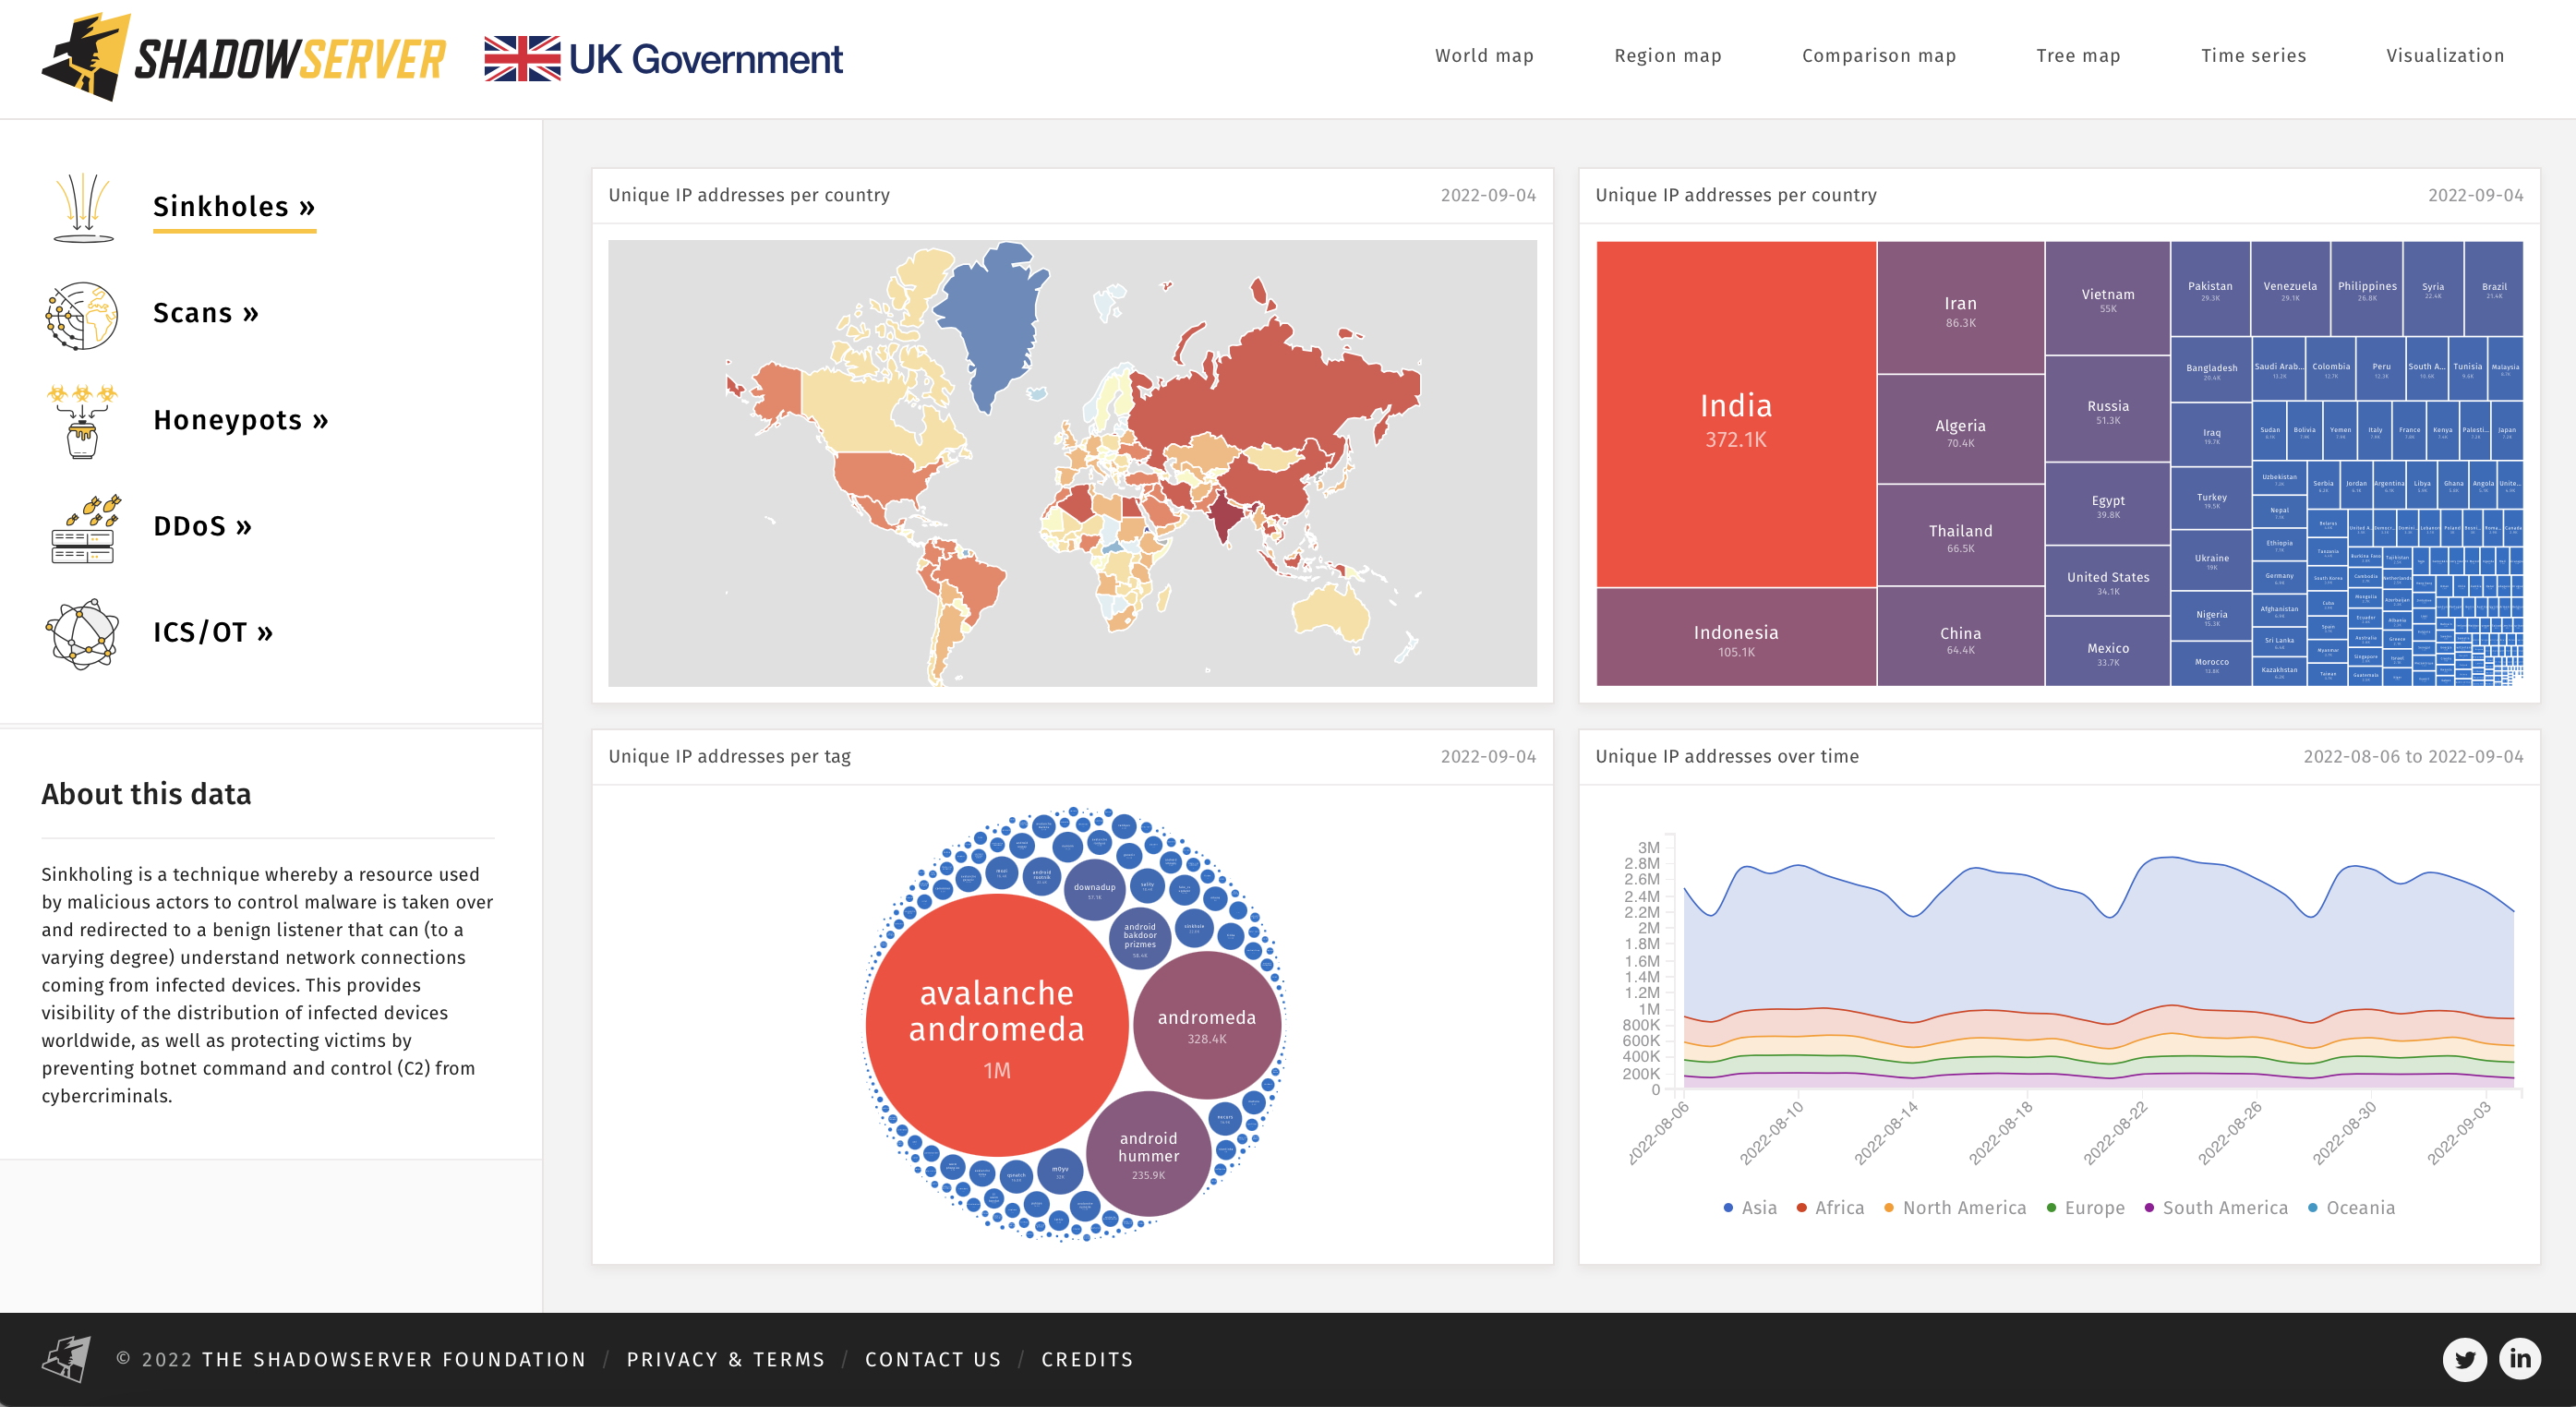
Our new Dashboard lets you explore some of the many facets of our Internet-scale data sets and learn more about how Shadowserver sees the state of cyber security globally, over a rolling period of the last two years. The Dashboard is based on aggregated country level data – no individual IP addresses or personally identifying information (PII) is included.
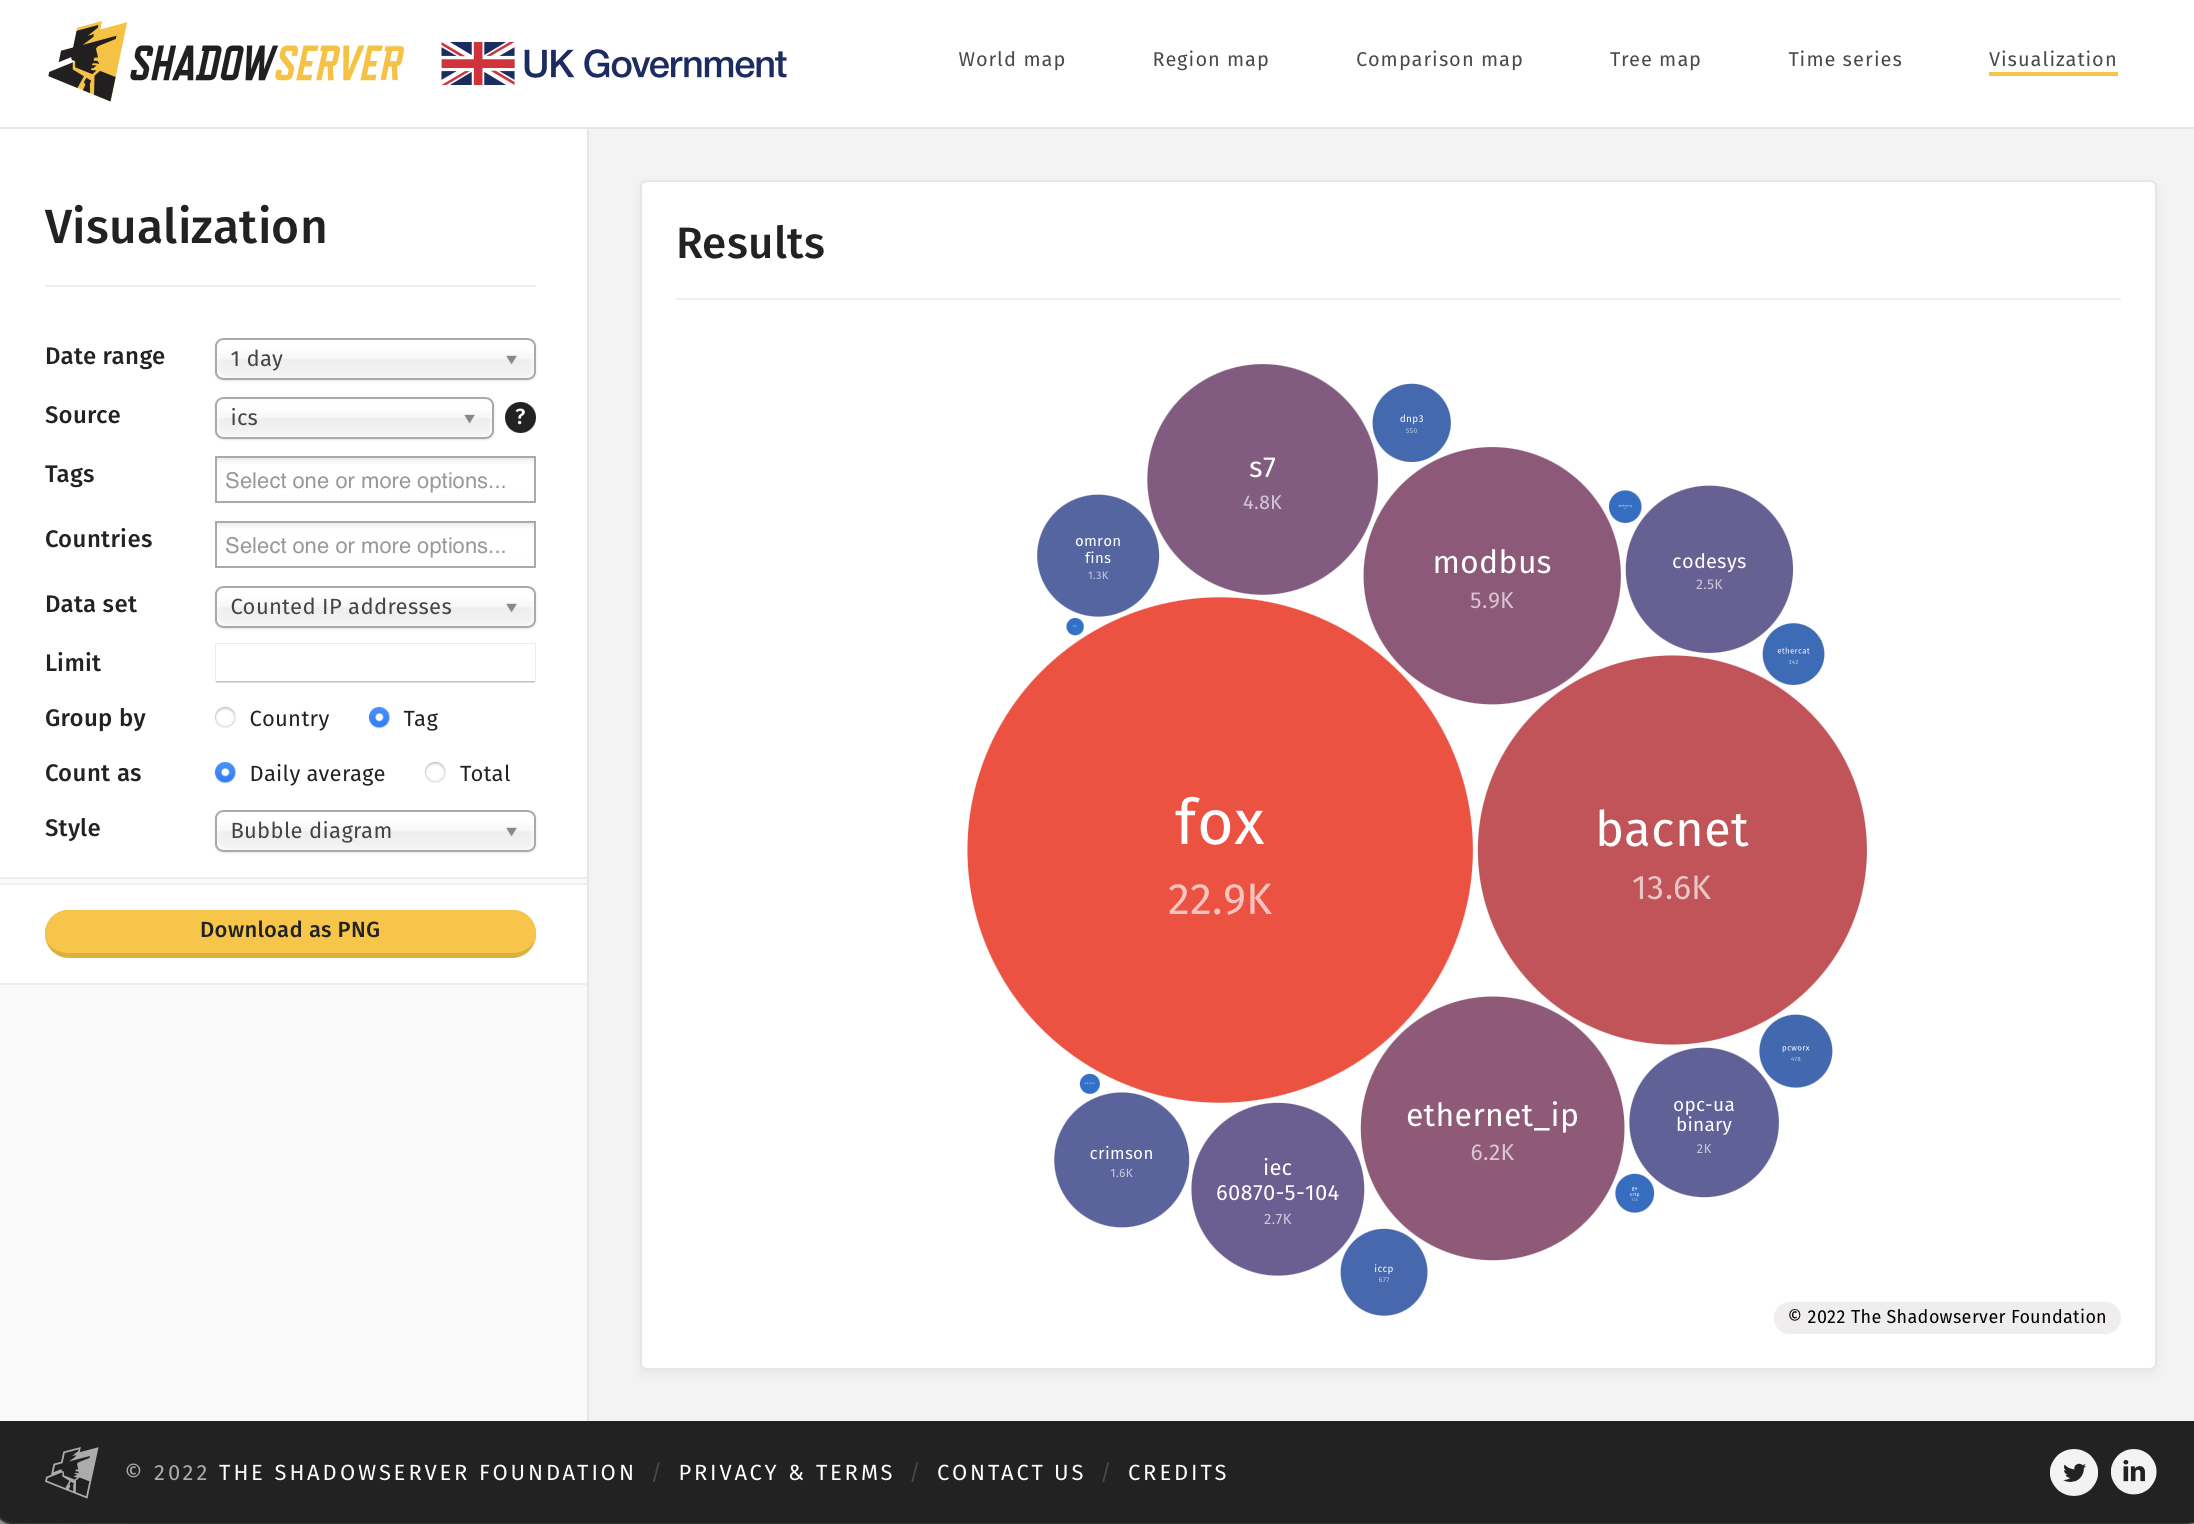
You can use our Dashboard to start with a global view, and then drill down into observations about a particular threat, or to compare statistics about two countries side by side. Initial filters for Sinkhole, Scan, Honeypot, Distributed Denial of Service (DDoS) and Industrial Control System / Operational Technology (ICS/OT) based data sets are included on the left navigation menu of the home page. There are various forms of data visualization available through the top navigation menu, such as time series graphs, world maps, region maps, treemaps and bubblecharts/tagclouds. Each data visualization should generate a unique URL for your query, so you can share links that easily recreate the same information and presentation style for others to view too, or for when you return to drill down further.
Our ambition for our new Dashboard is to empower security researchers, National CSIRTs, policy makers, journalists in the news media and other interested parties to use Shadowserver’s unique vantage point and extensive aggregated data sets as a public resource to help drive forward research and raise greater awareness of cyber security threats. With attribution, you can freely use our Dashboard for research purposes and to inform policy making, or to educate the public through news articles, but you are not permitted to scrape or resell the data. Please contact us if you have questions about licensing.
We will be posting a series of follow up articles that demonstrate how to use the new Dashboard effectively, and we will use Dashboard URLs to illustrate future blog posts and tweets.
To illustrate some of the new capabilities and data sets, here are some examples:
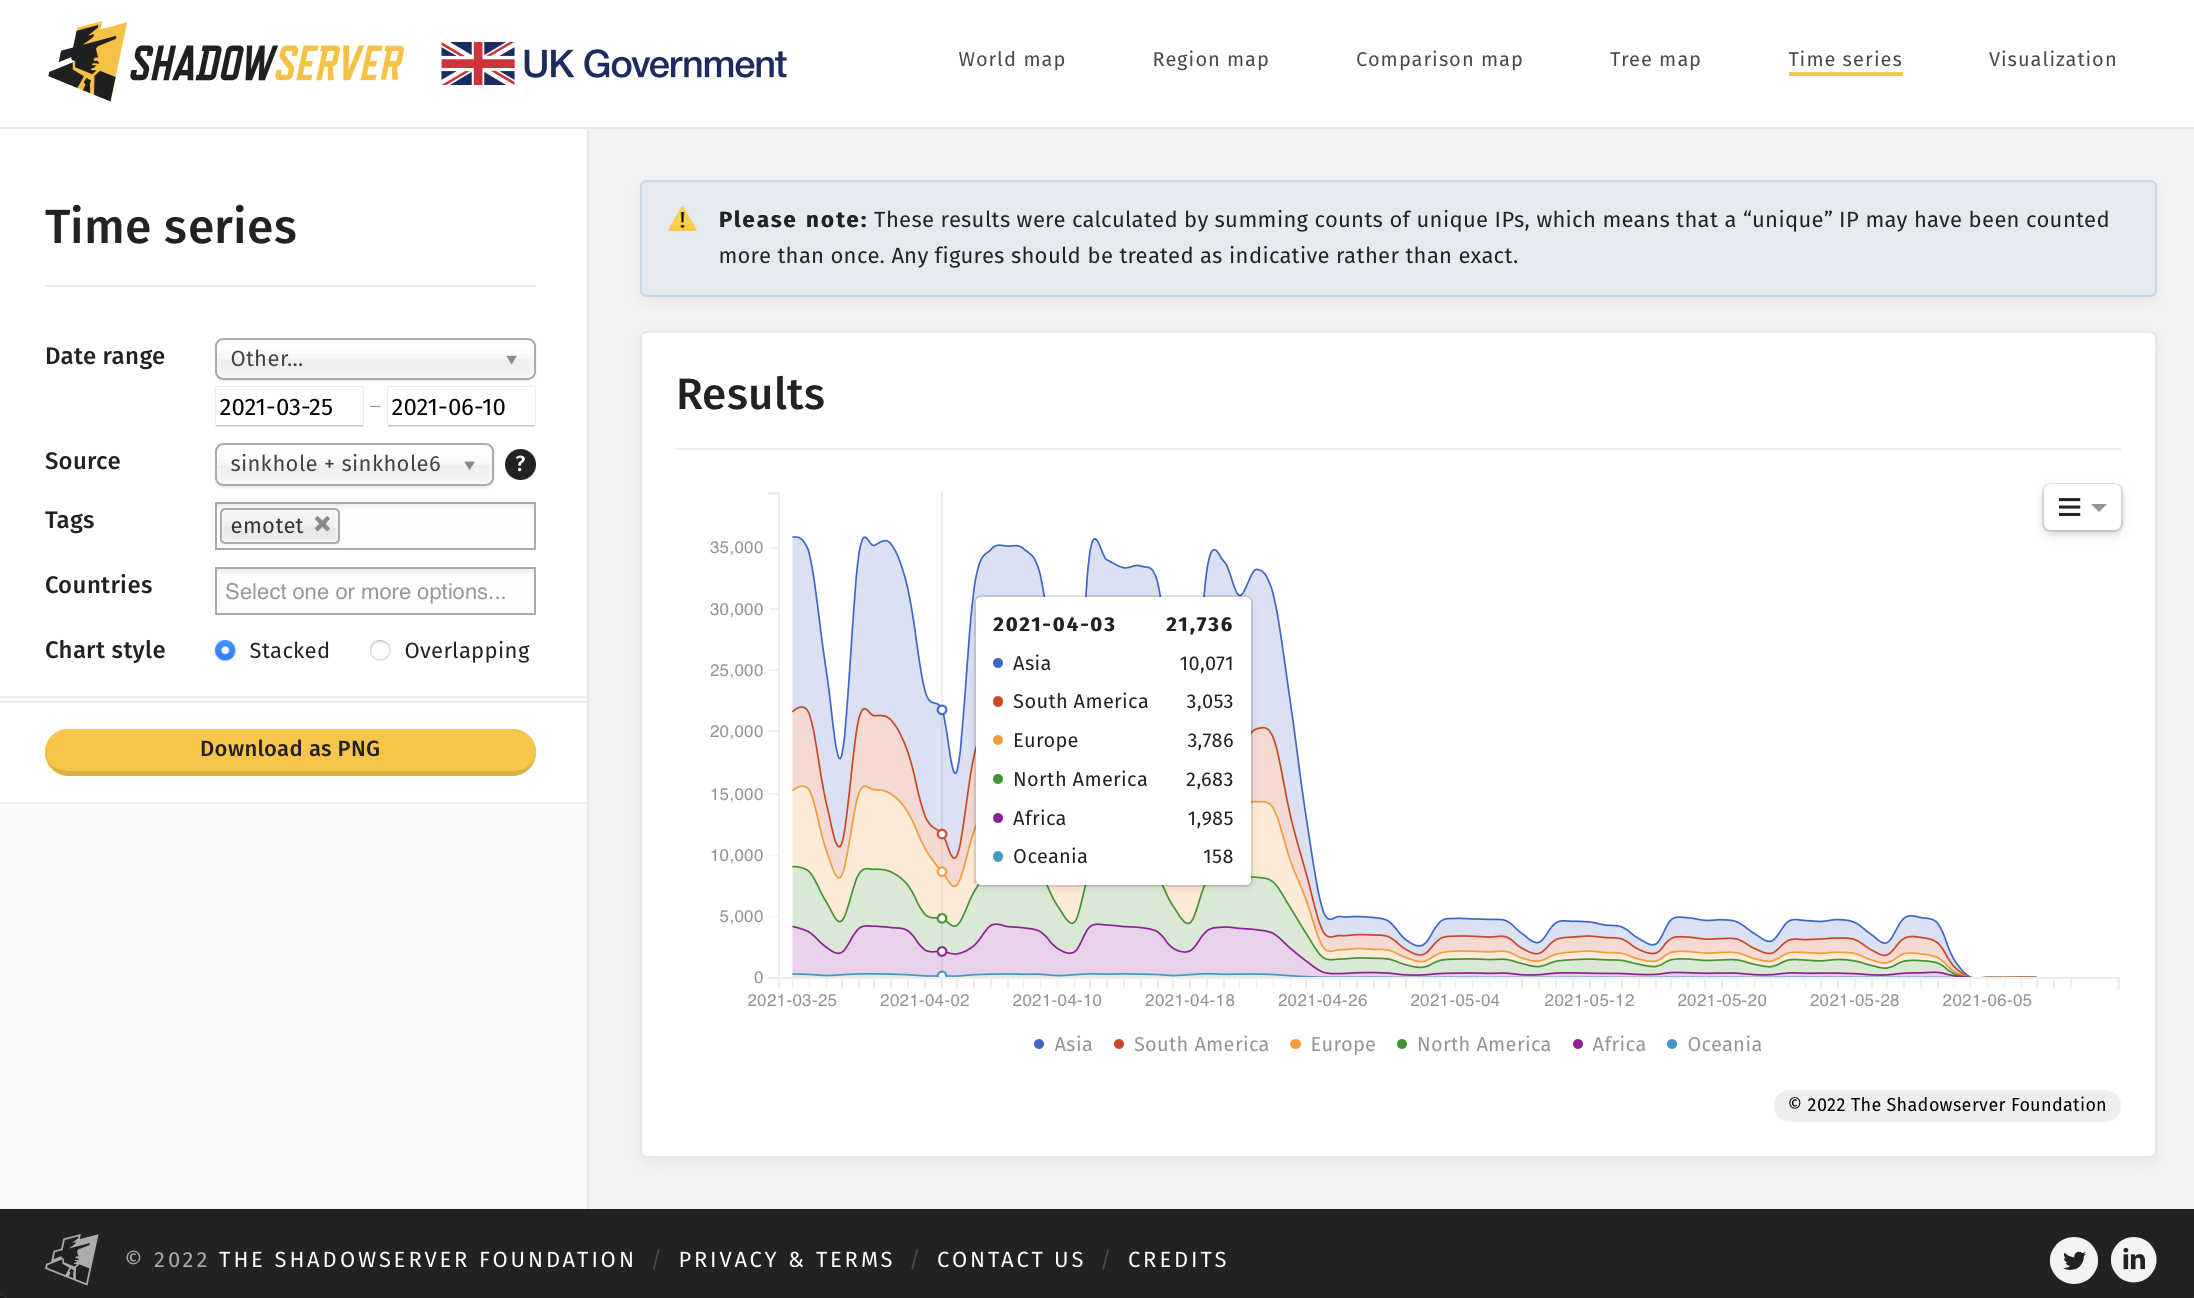
1) The impressive impact of the Emotet botnet takedown on the number of daily infected unique victim IP addresses in March 2021:
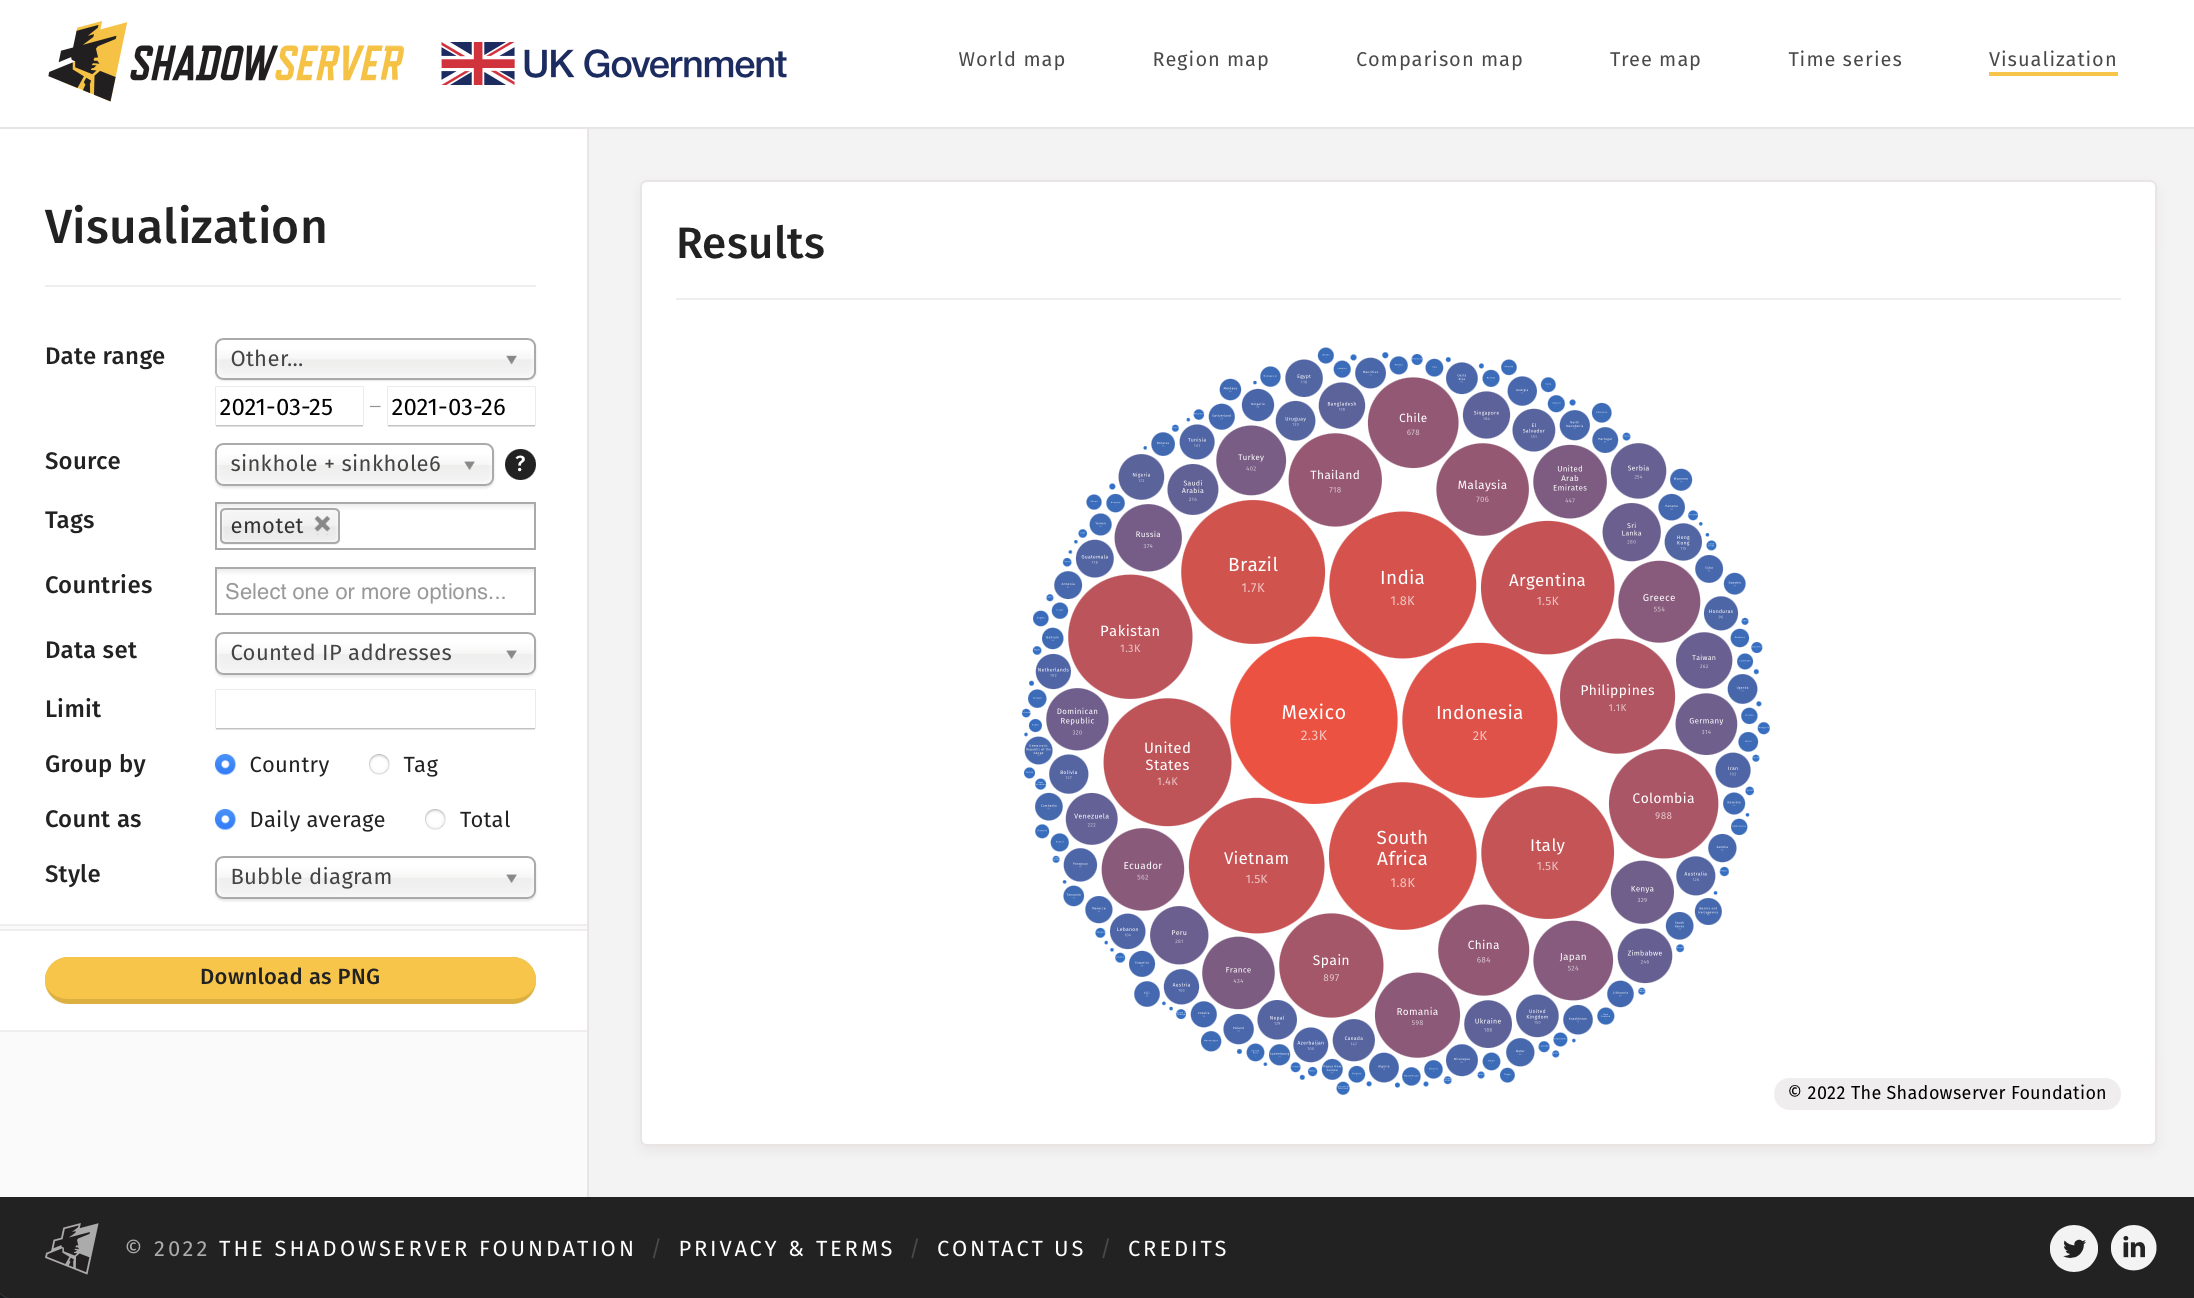
The distribution of infected Emotet victim IP addresses by country at the point of initial sinkholing:
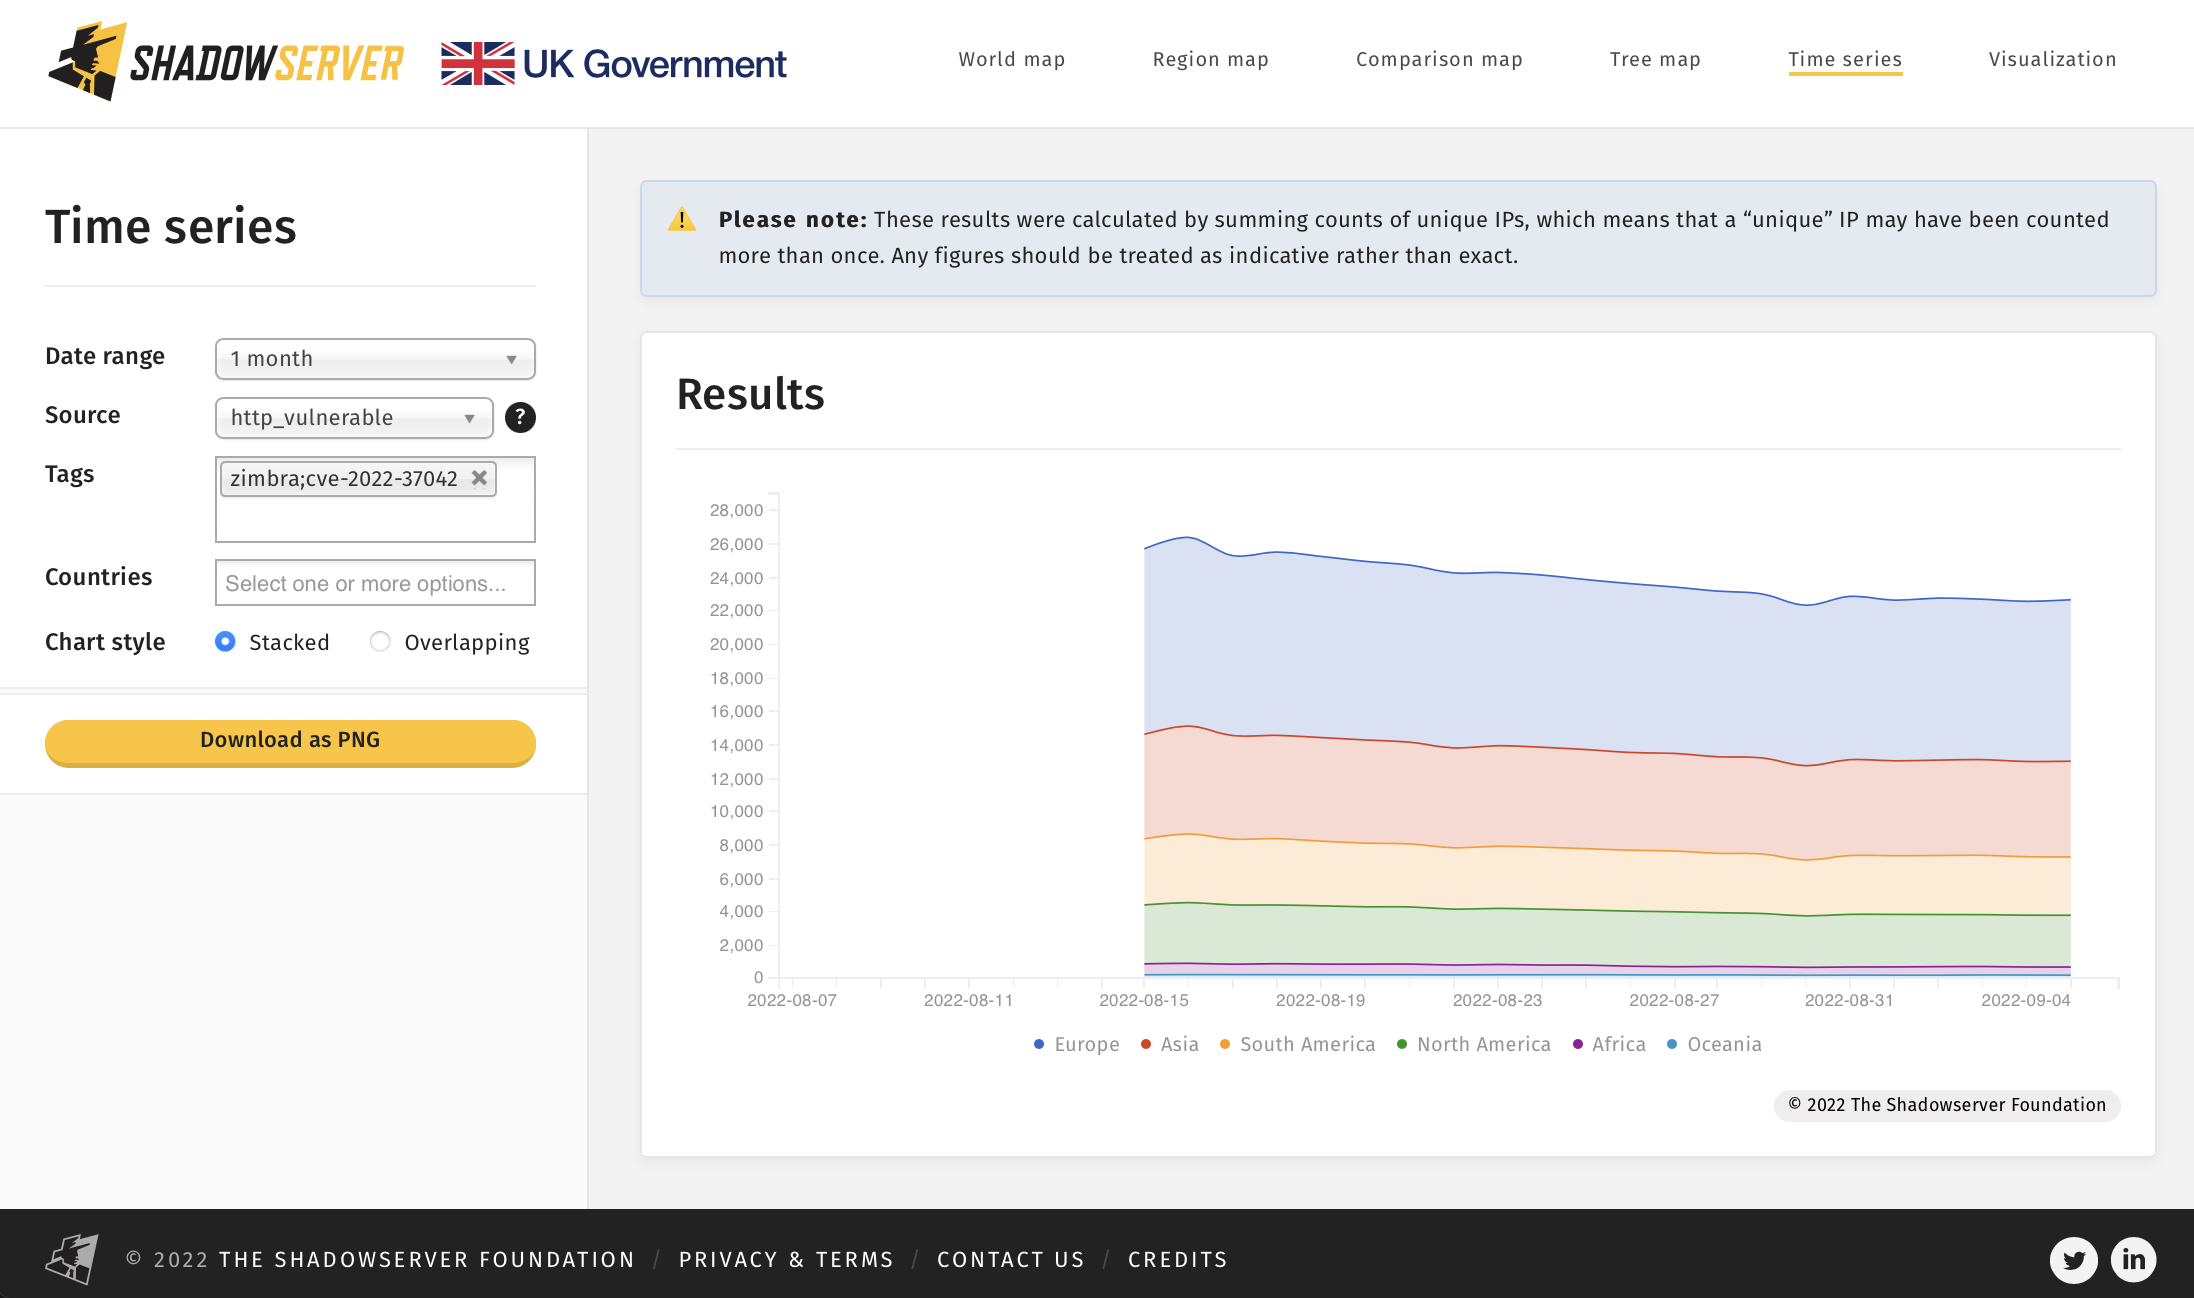
2) Good news! The amount of exposed Zimbra Collaboration Suite instances vulnerable to CVE-2022-27925 / CVE-2022-37042 is decreasing. We started reporting these vulnerable instances on 2022-08-13:
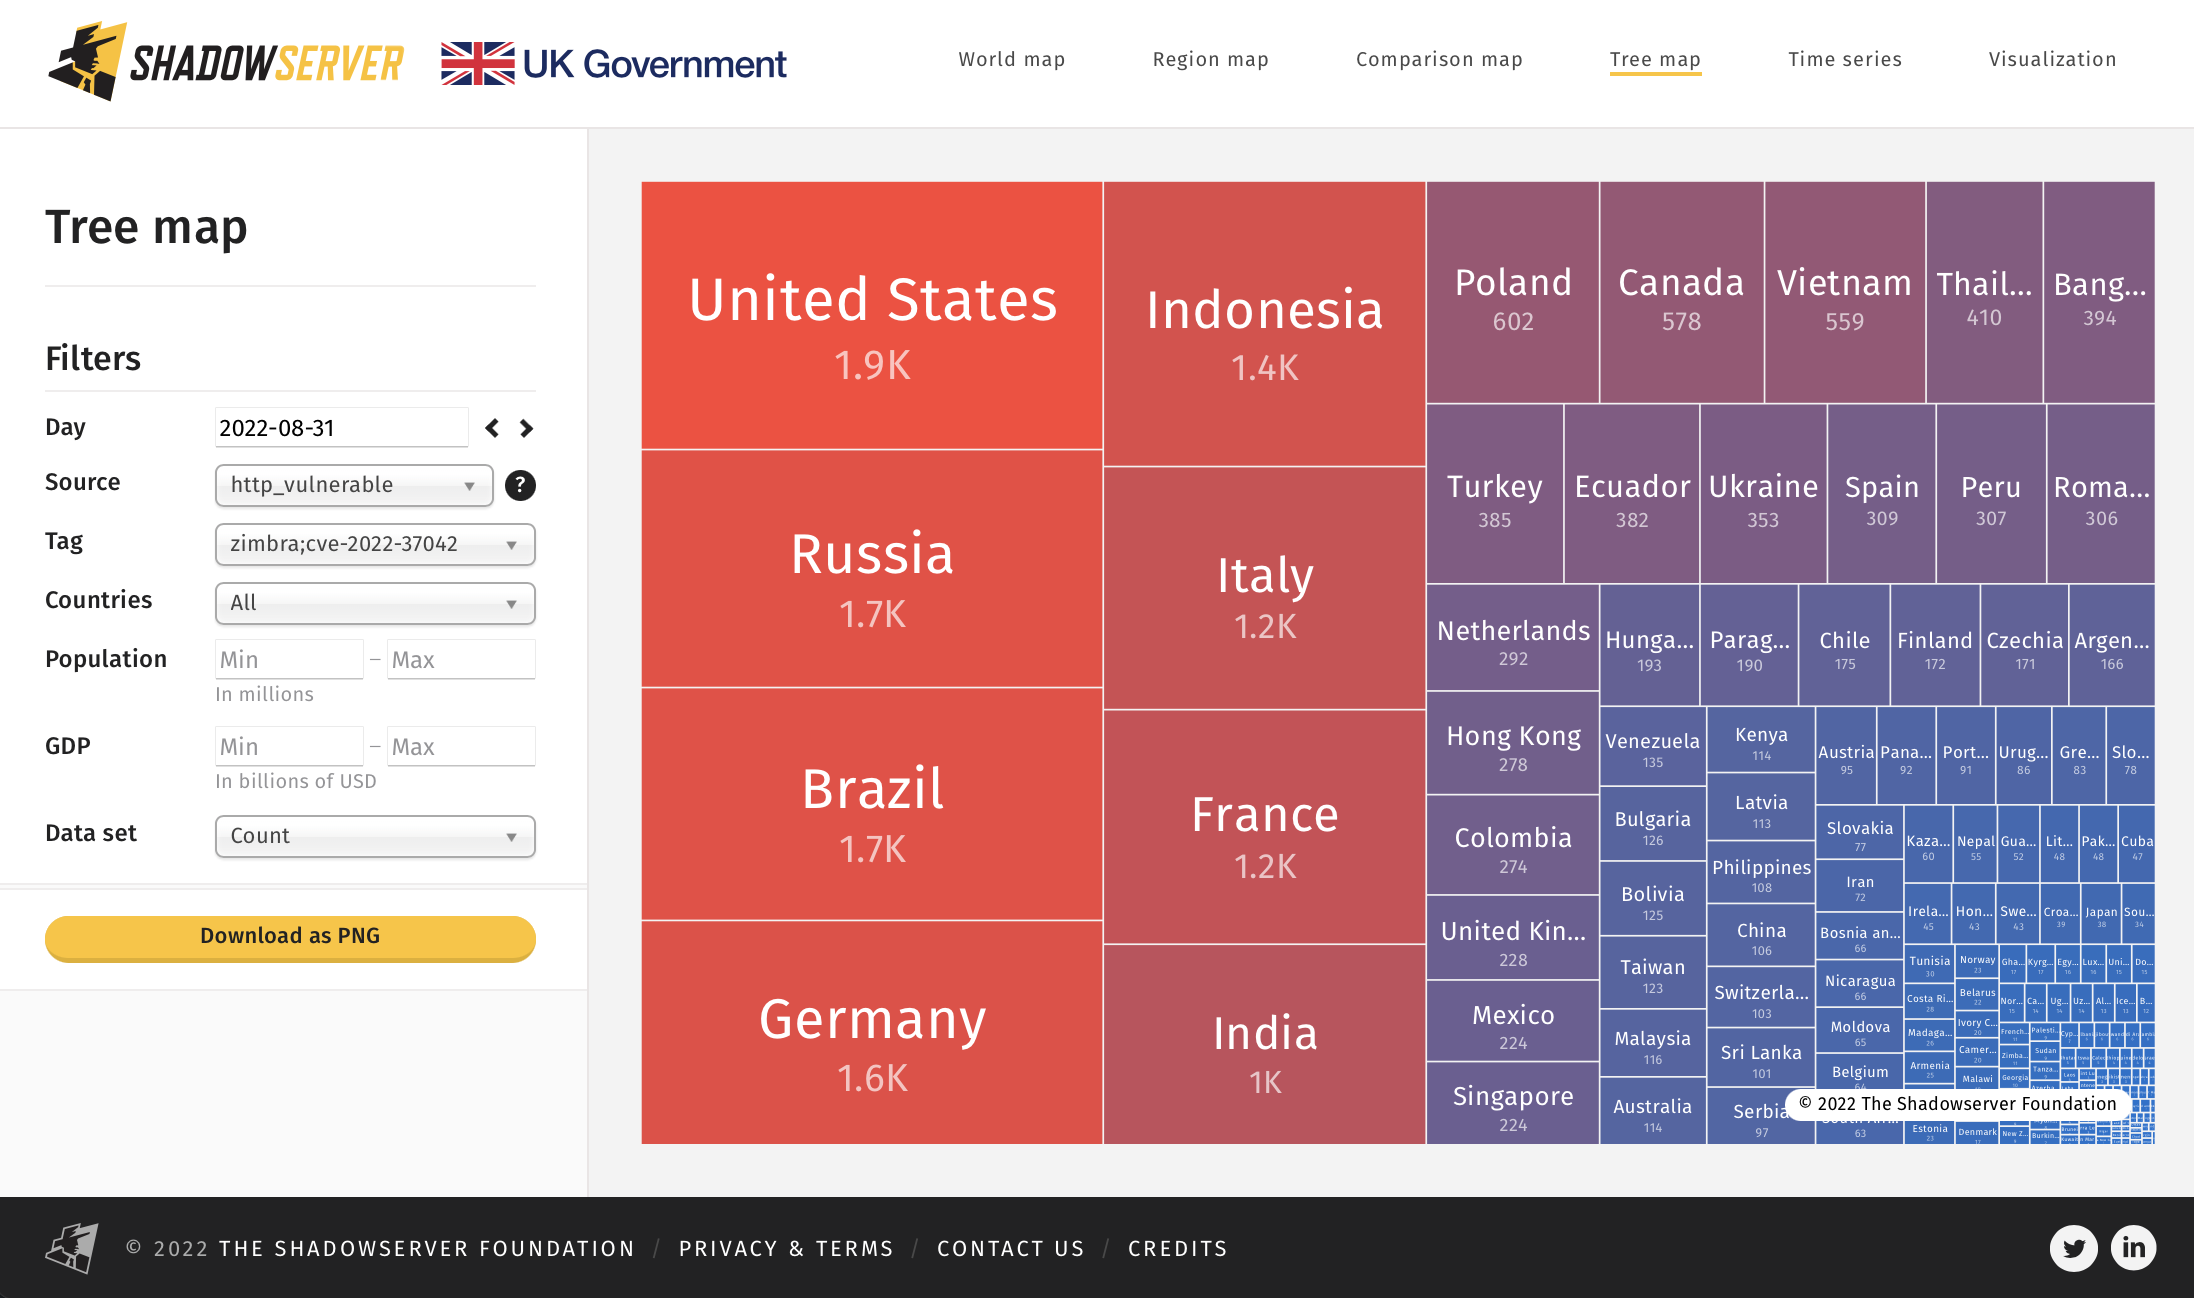
Location of vulnerable Zimbra Collaboration Suite systems, treemap by country:
Read more about recent Zimbra ZCS CVE-2022-27925 and CVE-2022-37042 here: https://www.cisa.gov/uscert/ncas/alerts/aa22-228a
Let’s push to reduce the amount of vulnerable instances even further!
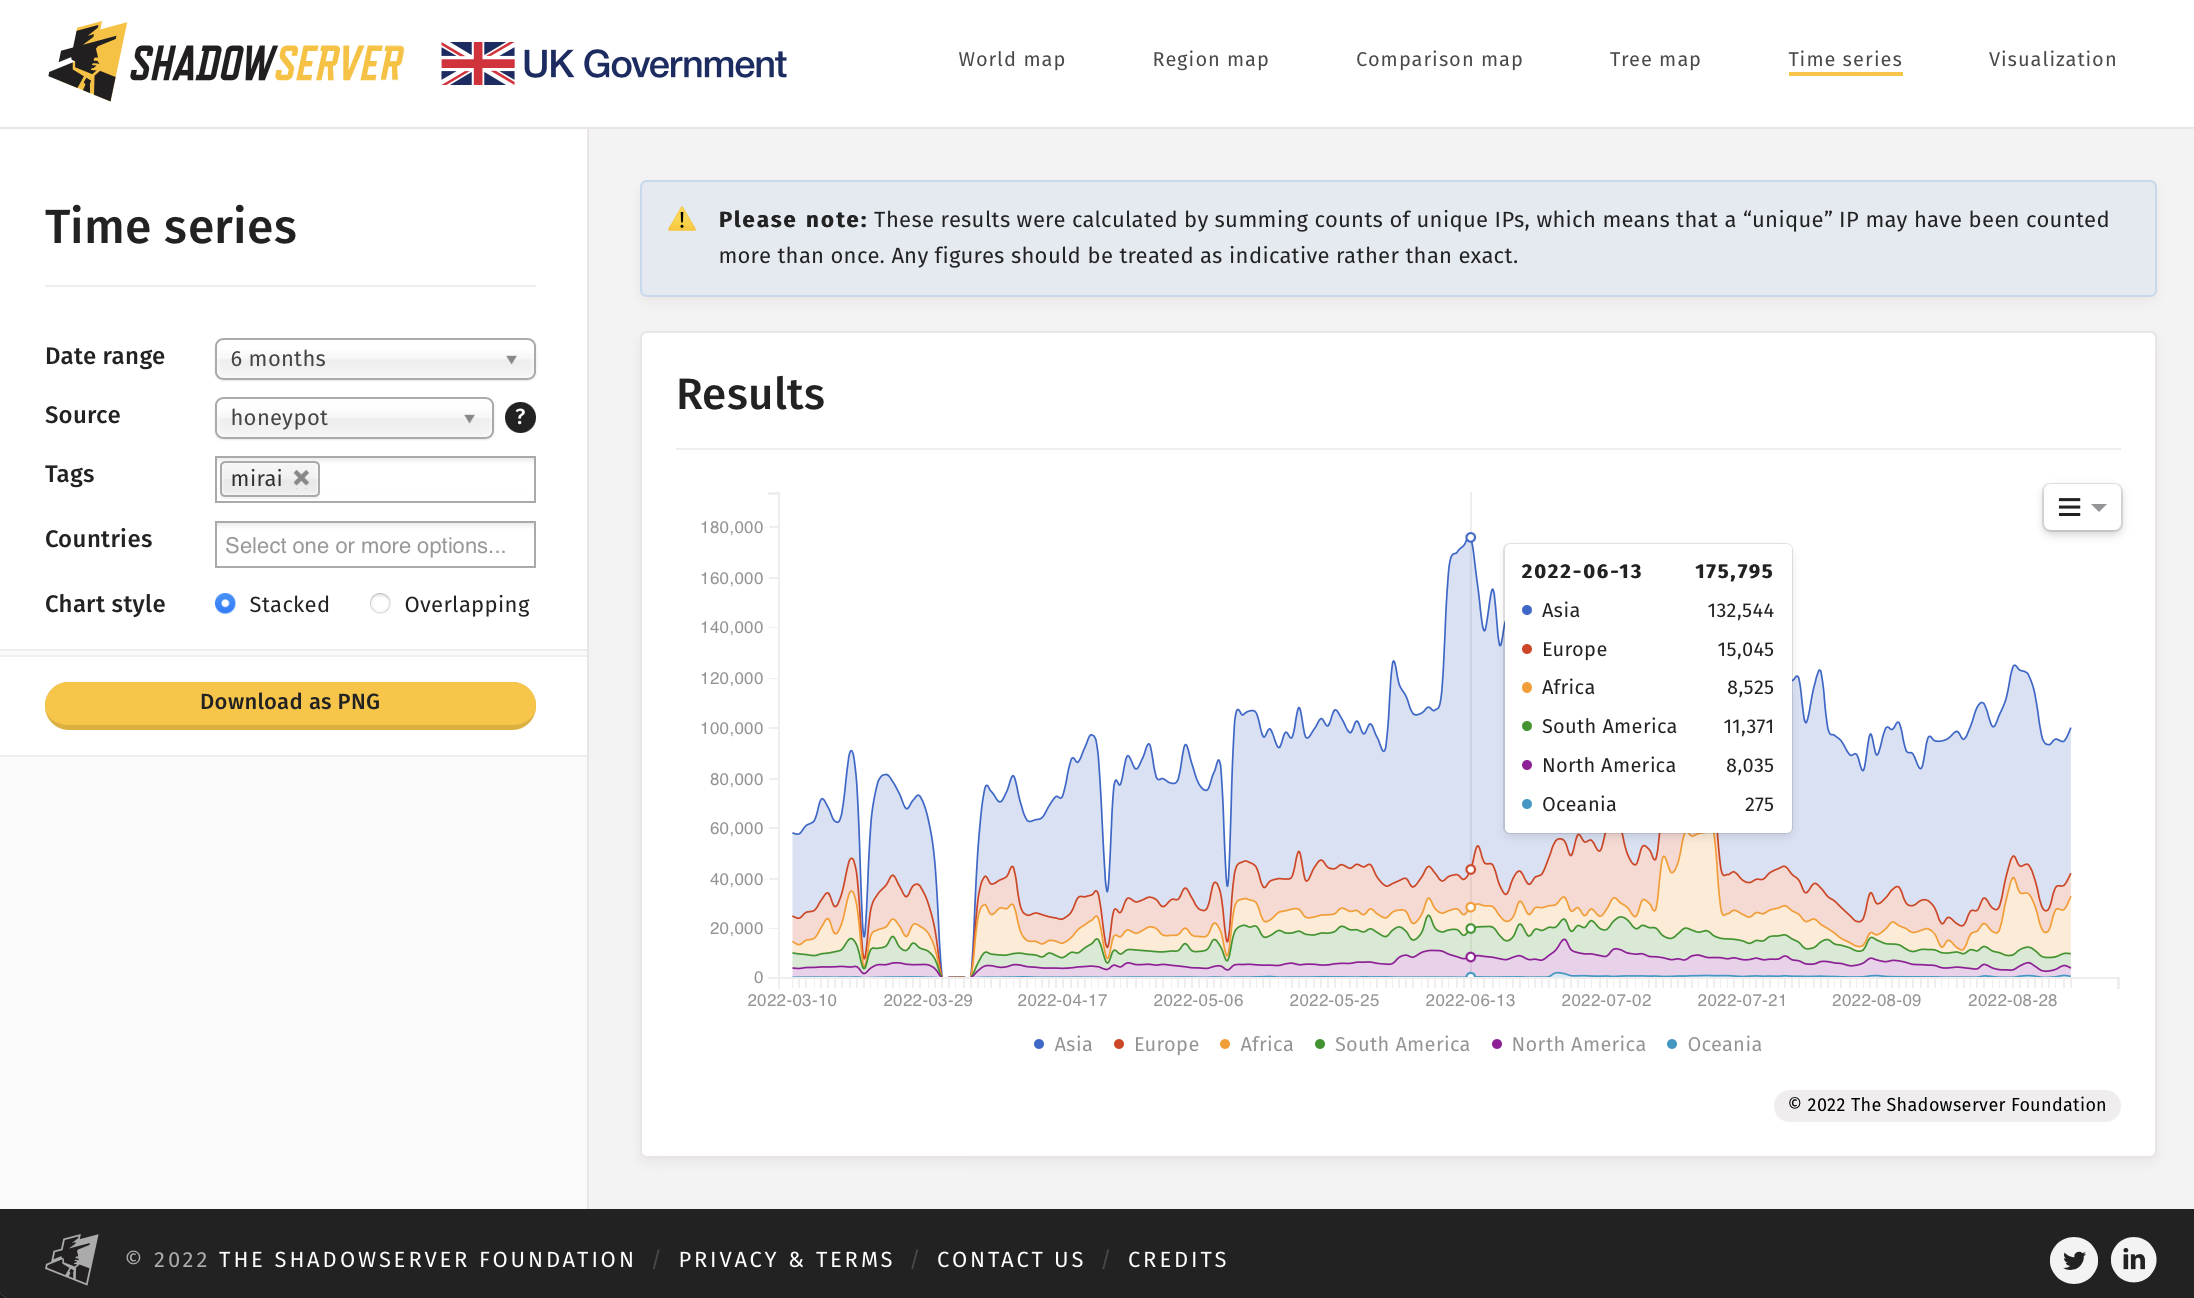
3) Mirai/IoT related botnet infections are on the rise again. What is the root cause and how can we work together to more effectively combat these threats?
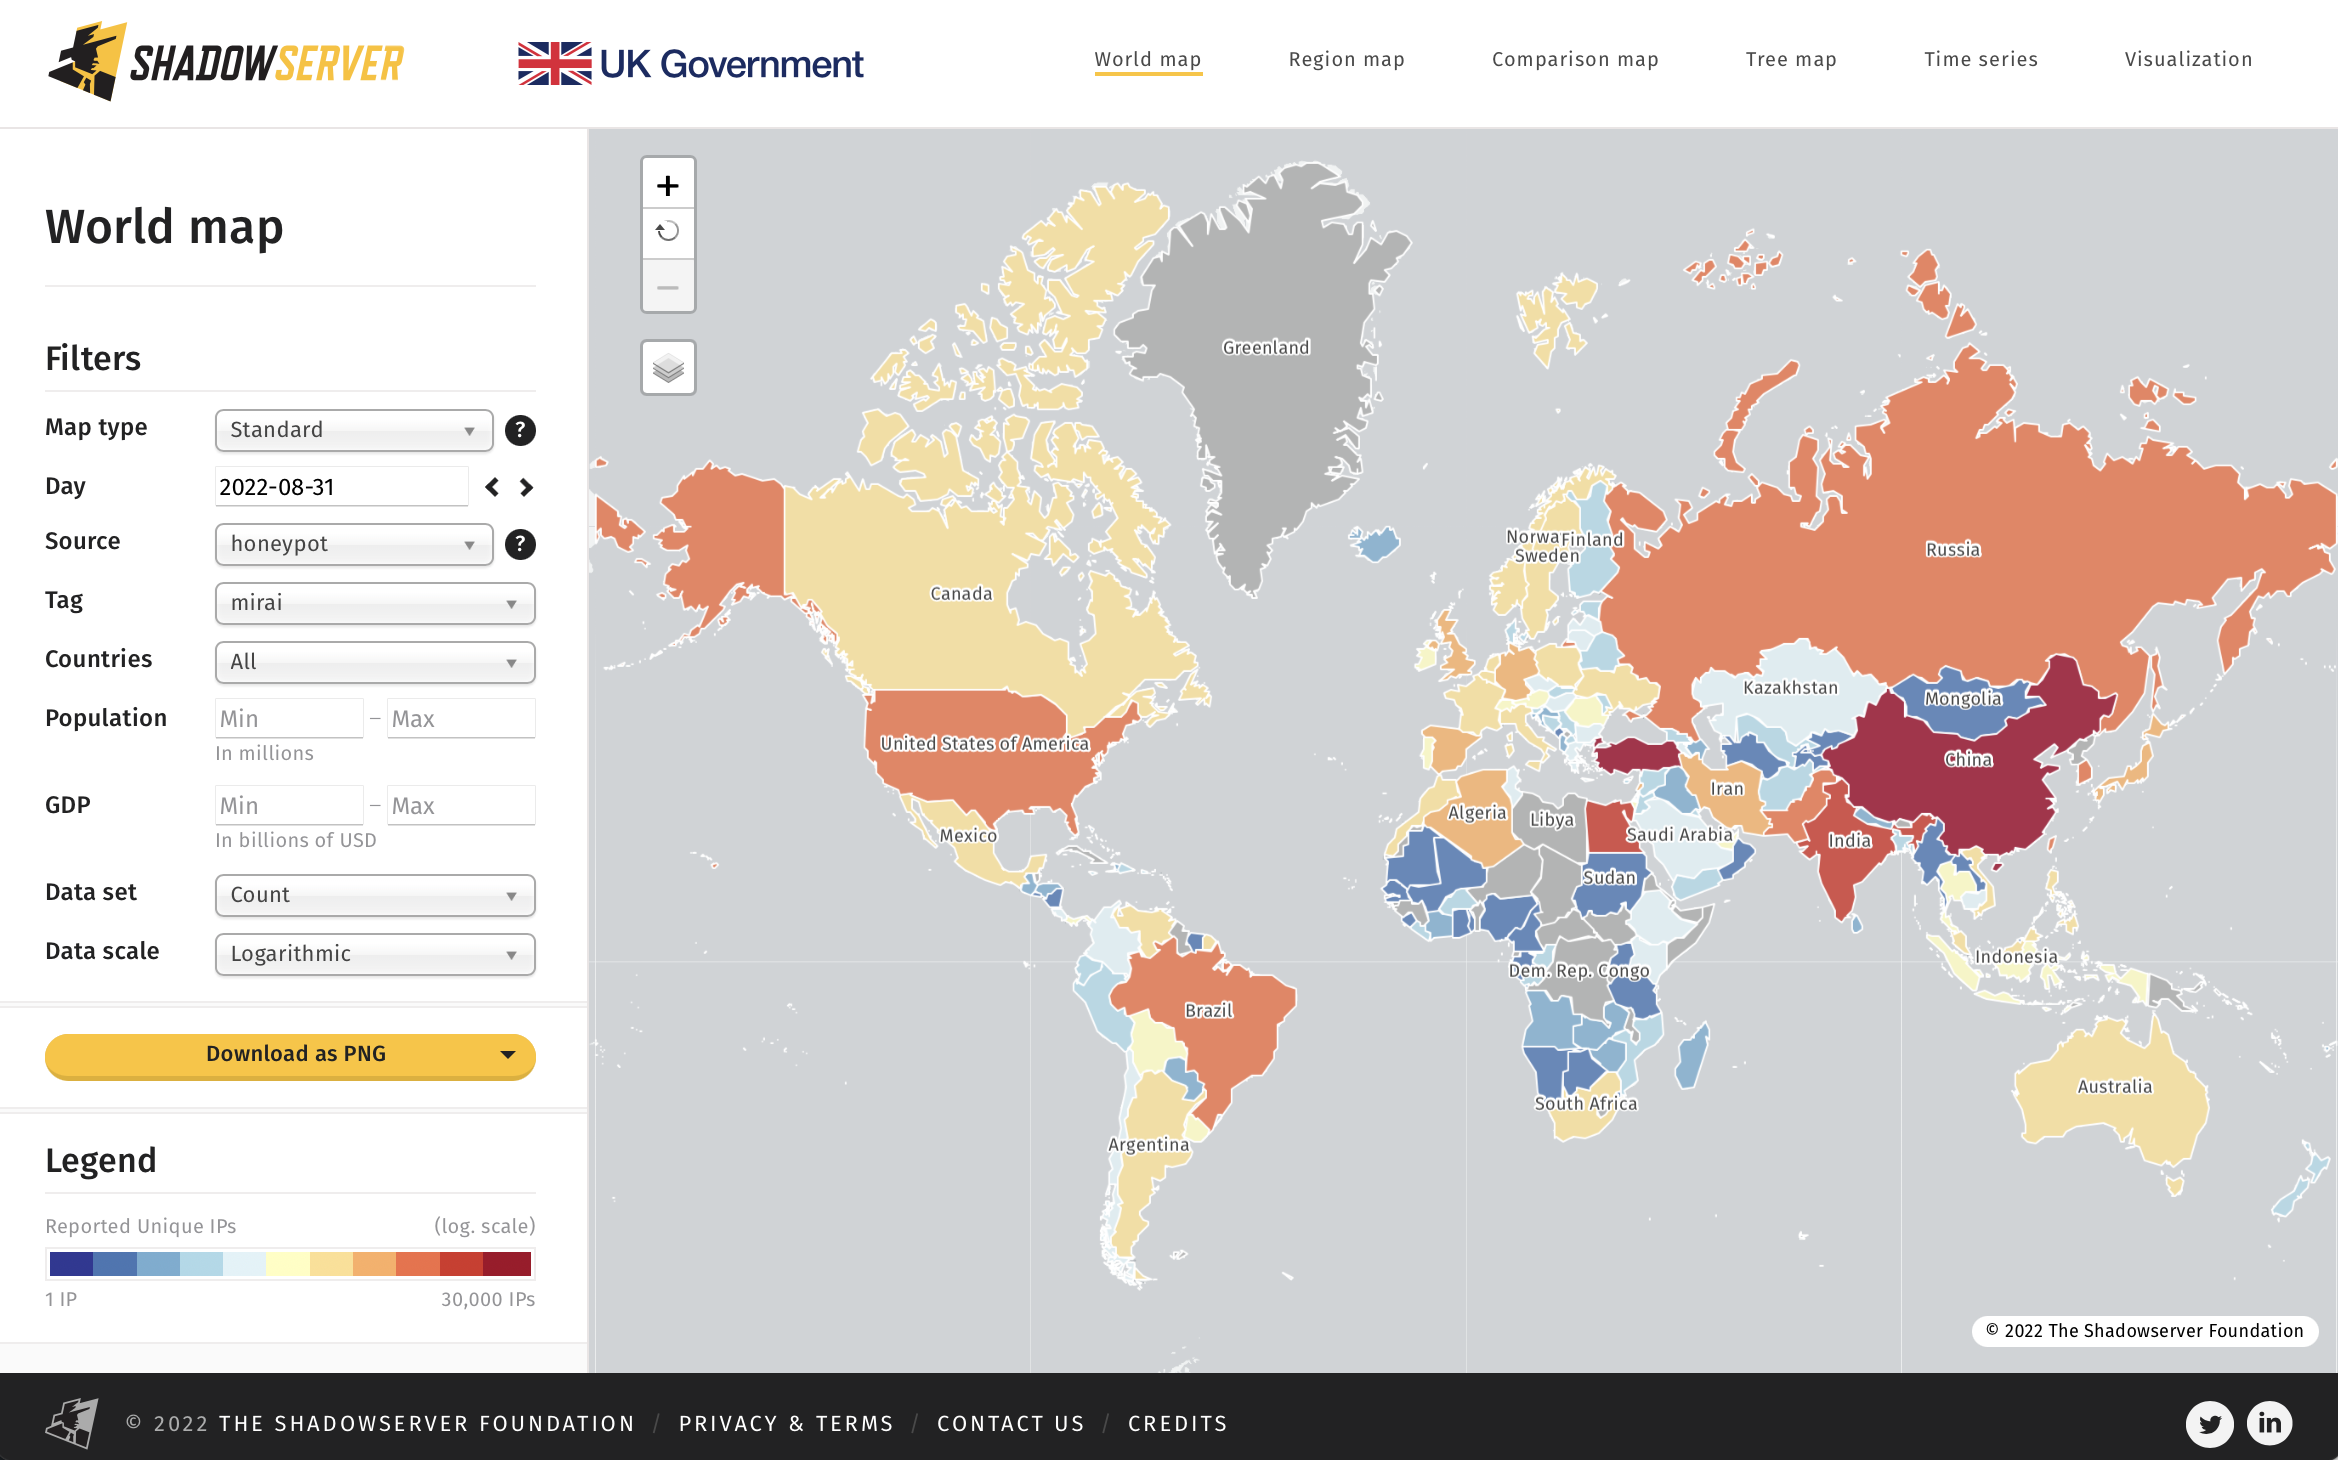
World map of detected Mirai bot locations:
As you can see, these examples are only the tip of the iceberg. Petabytes of global cyber threat data, including some unique data sets, are being aggregated and made available to the public for interactive exploration and visualization – for the first time. We hope you will be as excited about the new Shadowserver Dashboard as we are, and we look forward to hearing about any interesting trends or observations you find in the data.
Please contact us or engage us on Twitter if you have any questions or insights to share, and do let the UK FCDO know if you find our public Dashboard to be useful – we really appreciate their continued support for our free public benefit services.
We are always interested in collaboration and will be adding more data sets to the Dashboard over time, as it becomes our go-to landing place for exploring data about new and emerging threats. We hope to eventually provide our constituents with authenticated access to more granular views of our data about their own individual networks/country through expanded, private dashboards. Join our new Shadowserver Alliance to help influence future research direction and gain additional behind the scenes insight on threats to global cyber security.
If you operate a network or CSIRT and don’t already subscribe to Shadowserver’s free daily network reports, please sign up here.