The Shadowserver Foundation is a nonprofit security organization working altruistically behind the scenes to make the Internet more secure for everyone.
Our Story
What We Do
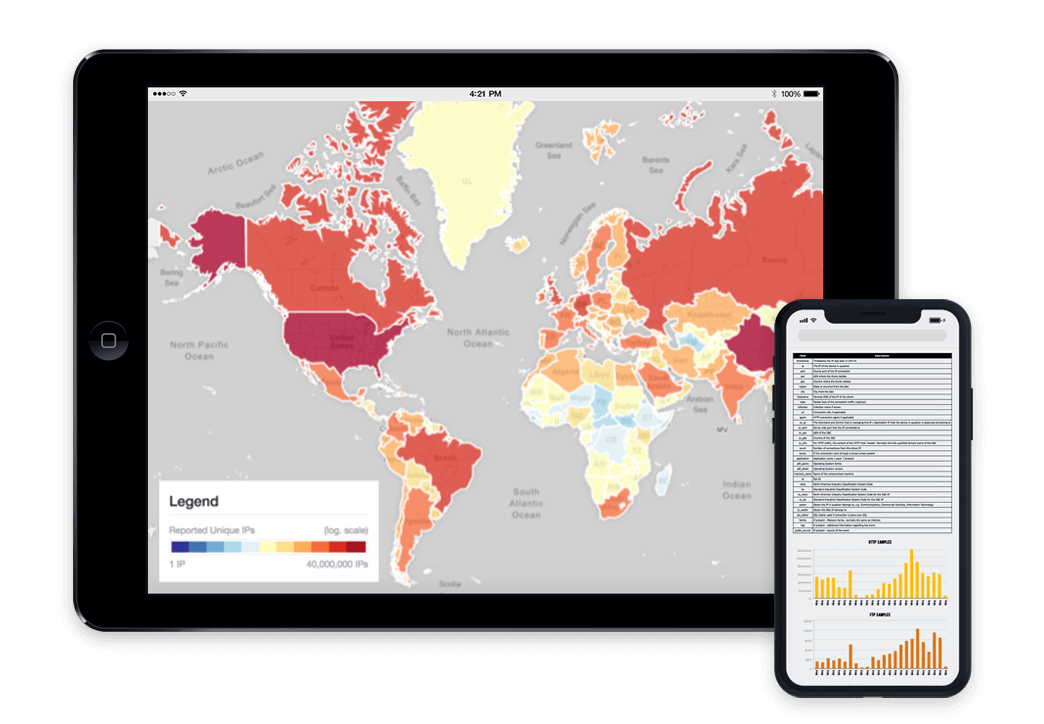
We collect vast amounts of threat data, send tens of thousands of free daily remediation reports, and cultivate strong reciprocal relationships with network providers, national governments and law enforcement. We bring malicious activities and abusable vulnerabilities out of the shadows, expedite their remediation and help to better secure the Internet.
Find Out More
Who We Serve

National CSIRTs
We give CSIRTs the vantage point to understand the big picture of what’s happening on the networks they’re responsible for.

Industry Sectors
We work with business and tech firms, financial institutions and academia, to improve network security, enhance product capability, and advance threat research.

Law Enforcement
We partner with law enforcement to help protect victims, take down global cybercrime infrastructures and prevent attacks before they occur.
Help us make the Internet more secure
The Shadowserver Foundation is an altruistic, public benefit, nonprofit organization funded by sponsorships, grants, and charitable donations.